Threat Hunting: Velociraptor for Endpoint Monitoring
A velociraptor is a tool for collecting host-based state information using Velocidex Query Language (VQL) queries.
To learn more about Velociraptor, read the documentation on https://www.velocidex.com/docs
Table of Content
- Introduction to Velociraptor
- Architecture
- What is VQL
- Prerequisites
- Velociraptor Environment
- Velociraptor installation
- Addition of host
- forensics investigation / Threat Hunting
- Chrome Hunting
- Let’s Begin some Forensics investigation
Introduction to Velociraptor
Velociraptor is a free and open-source software project developed by the Velocidex Company. It is generally based on GRR, OSQuery, and Google’s Rekall tools. Velociraptor allows users to collect Forensics Evidence, Threat Hunting, Monitoring artifacts, Executing remote triage process. As an open-source platform, Velociraptor continues to improve and evolve through inputs and feedback of digital forensics investigation and cybersecurity practitioner
Velociraptor natively works on Linux, Windows, and macOS. You can create or deploy a server within few minutes using SCCM or Group policy.
Architecture
Main components- all in one binary
Frontend
- Receive connections from clients
- Queue message to clients
- Process Responses from clients (Flows)
GUI
- Allow Scheduling Flows/Hunts
- Inspect results from Flows/Hunts
- View the client’s virtual file system
What is VQL
Velociraptor Query Language (VQL) is an expressive query language designed to adapt your requirements easily without doing any modifications in codes, Query, or artifacts nor deploying any additional software.
VQL encapsulates digital forensics expertise into human-readable files called ‘artifacts’ which can be shared and exchanged freely within the community.
Let’s begin
As shown in the above image there are a few agents like windows or Linux or cloud distros… these agents will point to TCP port 8000 while Digital forensics or cybersecurity experts will consult the web interface to TCP port 8889. The best part of this Architecture is if one of the computers leaves the office or another environment and operates from home or by any other place, it will be able to continue reporting to the server.
Prerequisites
To configure Velociraptor in your Windows Platform, there are some prerequisites required for installation.
- Windows 10 with minimum 4gb Ram and 4 CPU cores
- Admin privileges
- CMD with admin Privilege
Velociraptor Environment
In this blog we will target to install Velociraptor on windows 10, to make it as real as possible, the installation can be carried out to a server in the cloud as shown in the image above. In this blog, I’m going to use windows 10 as a server. You can Download Velociraptor by following the below Link.
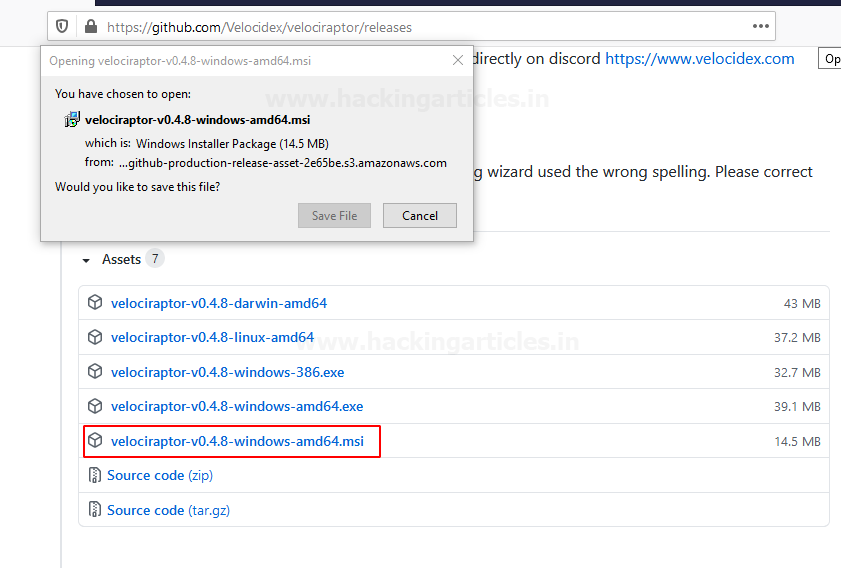
https://github.com/Velocidex/velociraptor/releases
Windows Version
To download the latest version of Velociraptor in a windows server, go to the official GitHub page by following the above link then locate and select the option velociraptor-v0.4.8-windows-amd64.msi or you can directly download by accessing the above .msi extension hyperlink.
Velociraptor installation
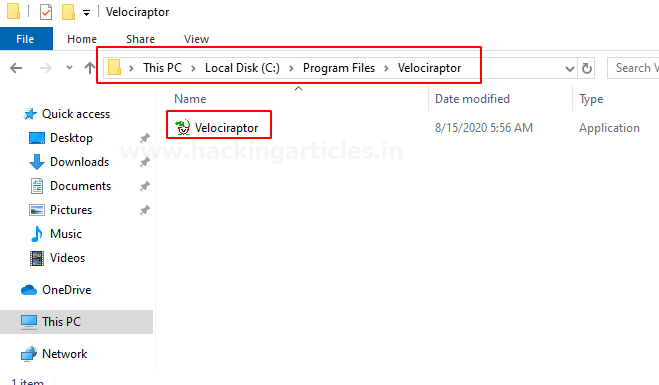
Let’s start deploying master server in windows And after the download complete what we can do now is to go to the download folder and just simply install it.
Here, windows will try to prevent this happening but once the installer is complete what we saw here is that under the program files have the Velociraptor folder.
Generating Configuration and Adding Users
Now let’s open the command prompt with administrator privilege and navigate to
cd C:\Program Files\Velociraptor
So now what we need to do is to generate the configuration to do this enter the below arguments into the CMD prompt
velociraptor.exe config generate -i

And we would like to generate the configuration for the Windows machine so select windows. Then hit enter. Select FilebaseDatastore. You can also go with the MySQL option but the MySQL option is suitable for the production environment. Then, next select the path of Velociraptor configuration “c:\window\Temp”. Then use Self-signed SSL. We would like to leave everything on default but if you have different requirements you can make changes as per your own. At last, we are not using any google domains so on that place type N and hit enter and enter till last to set options as default as shown In the image below.
Now you can check the configuration of your server by entering below argument
type server.config.yaml

As we can see, what the configuration for our server is. It sets our frontend is listening to localhost port 8000 and the certificate directory and so on. Basically, it’s just a description what the configuration for our server.
Now, since we have this part done what we need to is to add user and we can do it with entering the below command
velociraptor.exe --config server.config.yaml user add vijay --role administrator
And we need to create the password to access the GUI interface

Running the Server and Accessing GUI
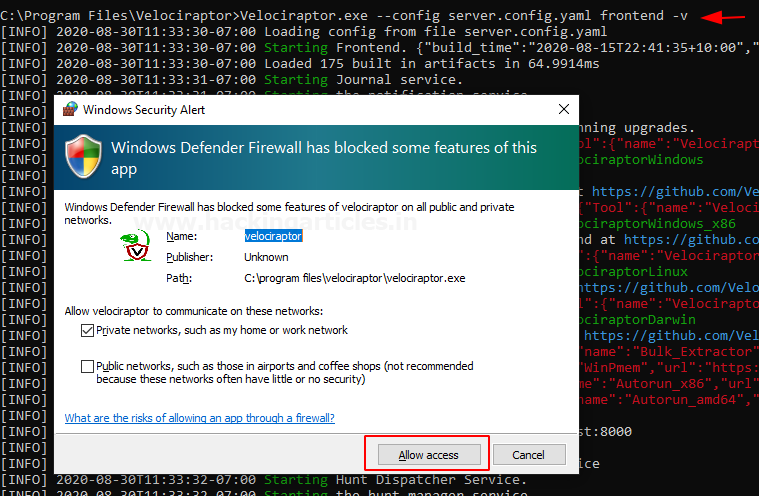
what we can do now is to run our server so how we can run it…. To do this issue the following command
velociraptor.exe --config server.config.yaml frontend -v
Here -v stands for verbose
By running the above argument a prompt screen opens on your screen that needs admin access to setting up the environment and then the setup continues.
Congratulations! Finally, you have setup Velociraptor in your windows machine. You can now access the Velociraptor GUI interface at your favourite browser by ping following URL
https://localhost:8889
And use your credentials to log in that you created at the time of installation.

After login into the interface, you’ll have your Velociraptor GUI dashboard
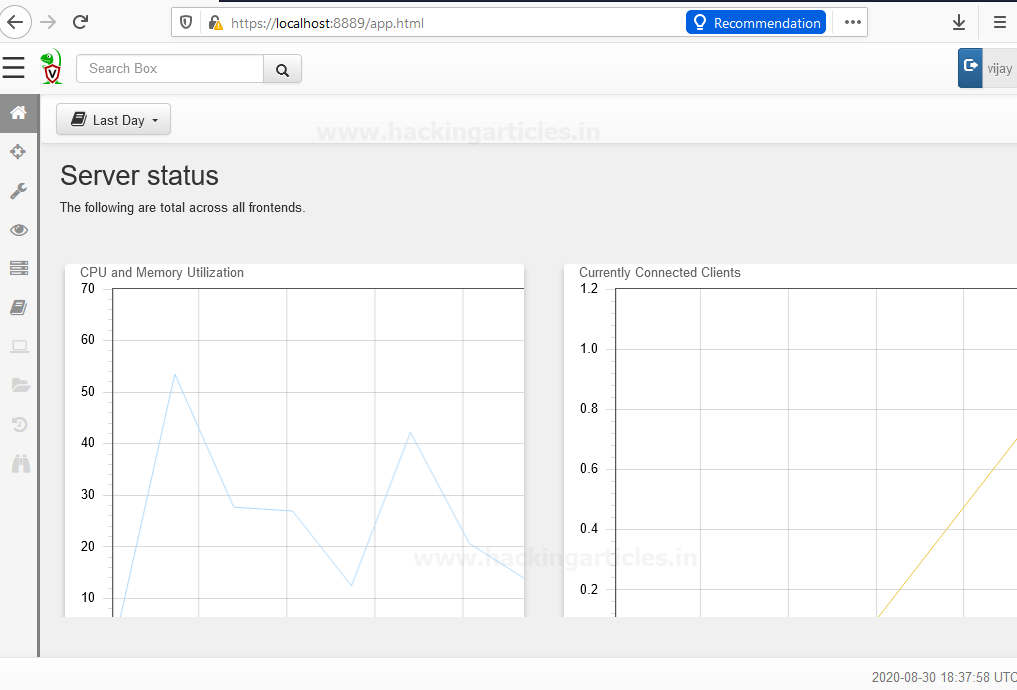
Here we can see the home page, which is about basically the load of the server, connected client’s users, and so on….and this is not all we can end to do….
Addition of Host
Currently, we have no clients connected to the server so let’s rectify that by opening a new terminal with admin privilege
And then follow the below arguments
cd C:\Program Files\Velociraptor
velociraptor.exe --config client.config.yaml client -v
Then, the client Is connected and is going to enrol in the specific server based on the client config file. So, you could use the client config file with very little modifications to enrol your client to your existing master server if needed in the future.
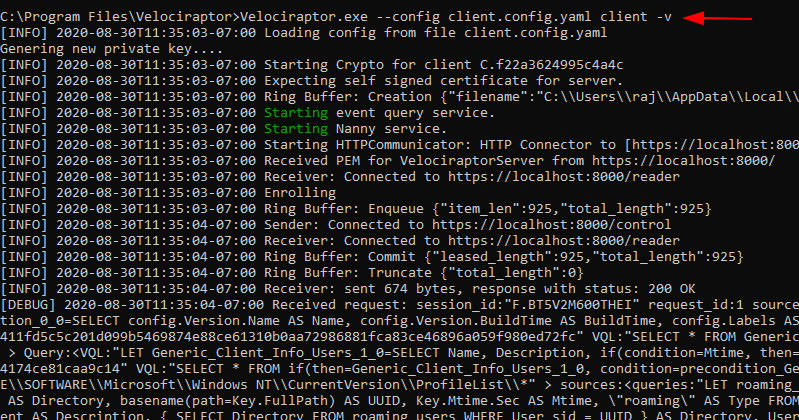
Now what you see is that your client has successfully connected to the localhost and we have one client added into the master server.
Forensics Investigation / Threat Hunting
Now if you go back to the homepage you could be able to see your host by searching in the filter box.

And then you can see the host have a client id, hostname OS version, and so on….
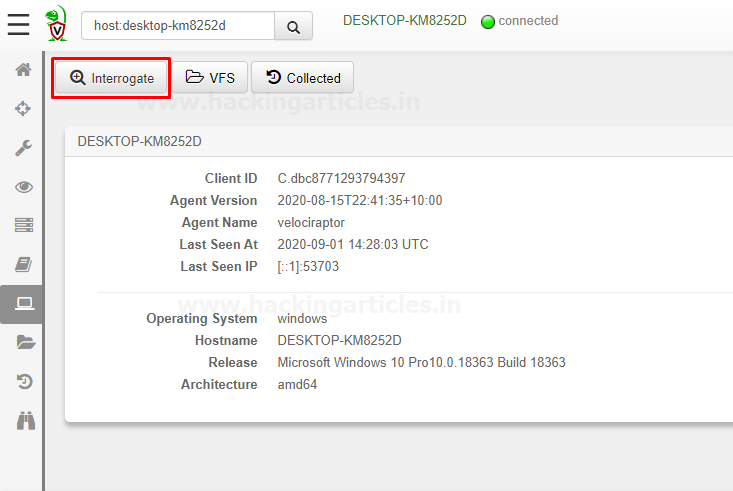
And we could interrogate the host and we could check collected information and by default, some basic information is collected about clients.
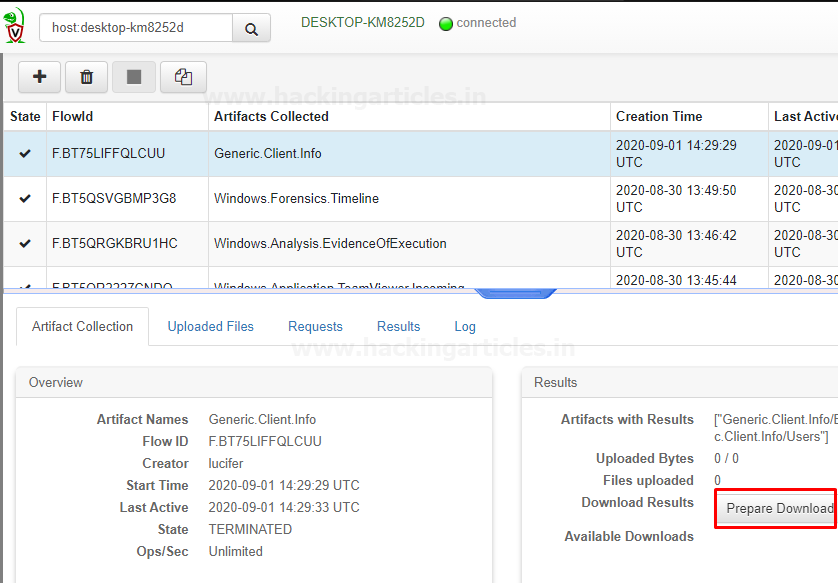
So now what we can and should do is to try to figure out what’s inside this information by downloading it. As we can see a zip folder downloaded inside downloads after opening it you can see these files there that contain the host details.

Let’s check what’s inside these folders open it one by one and this part is gonna a little bit special but it’s not enough
Hold tight! 😊

Wow! It contains quite useful information
Let’s dig it deeper
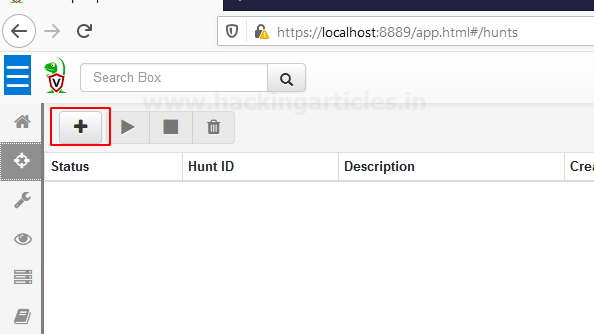
So now we have the Hunt manager you can easily find it on your Dashboard

Hunt manager allows you to hunt for the specific events that happened to your client. You can also view specific artifacts and you could see the server events as well and you could check server artifacts on the dashboard console of Velociraptor
Let’s begin the Hunt
We need to create a hunt with specific artifacts To do this move your cursor to the “+” button and select it as shown below.
Chrome Hunting
Now the time has come for us to like spy on our user HaHaHa 😊 with the help of our clients if they are using chrome. So we are going to check on which website or page they have visited recently unless they are not using incognito mode.
Creating and Running a Chrome Hunt
To create new hunt in the search window start typing windows then select the artifacts that you want to hunt and add then select “Next”,
In my case, I’m selecting Chrome Cookies, Chrome Extensions, Chrome History you can select as much you want.

After selecting next it redirects you to next prompt when you need to Hunt Description and then select “Next”

Hunt conditions should be in “operating system” select it in the drop-down menu of Include Condition then select Target OS “Windows” and then hit “Next”

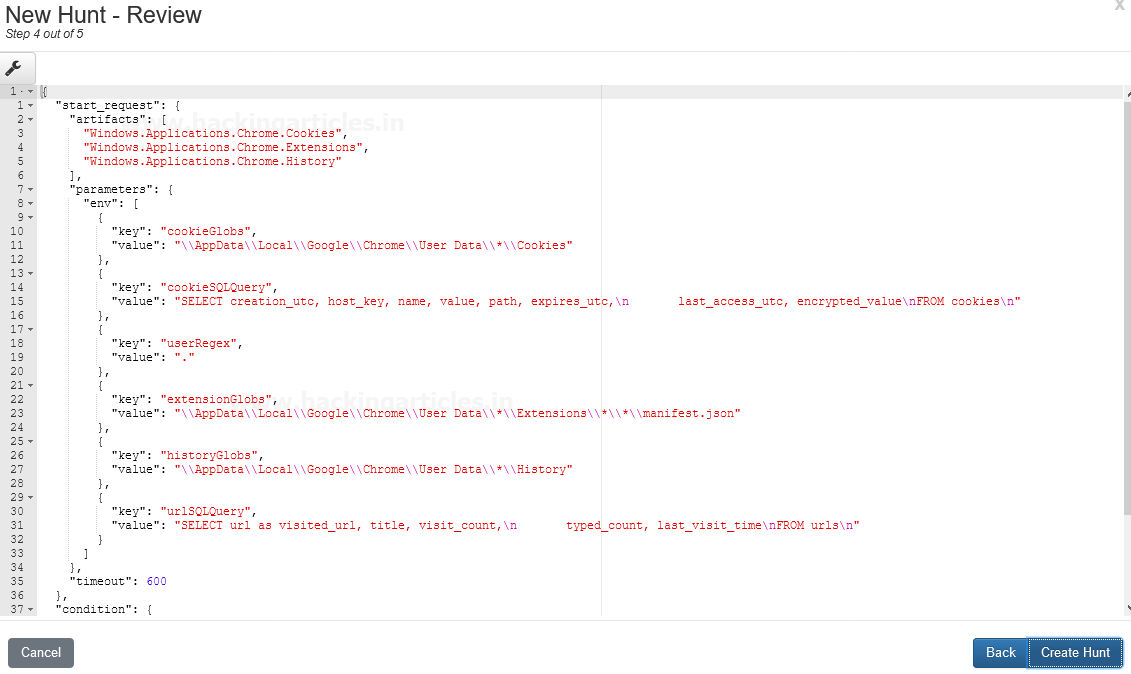
At next screen, you have your hunt Description or Artefact review. If you do some modifications with the artifacts if needed otherwise leave it as default and then select option “Create Hunt”
Now we have created a new Hunt Named Chrome Hunting it reflects to your Hunts panel
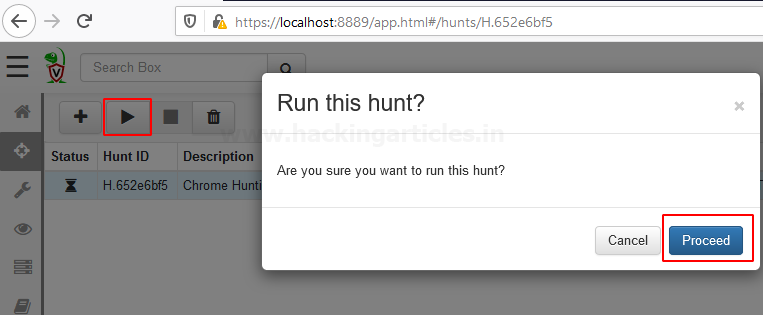
And We would like to run this hunt by pressing the play button to see what’s next in the result…

Then a pop flash on your screen that wants your permission to proceed…
After proceeding it will take you to next screen where you have your hunt results you can select which results you want to see by drop down the Results tab
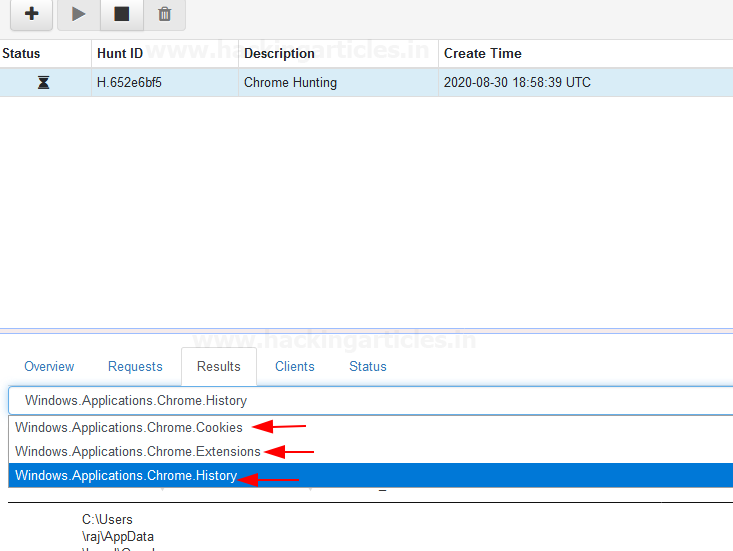
As we can see we have a history of chrome that the client used to visit on the chrome

Also, we can see chrome cookies by select It form Results dropdown

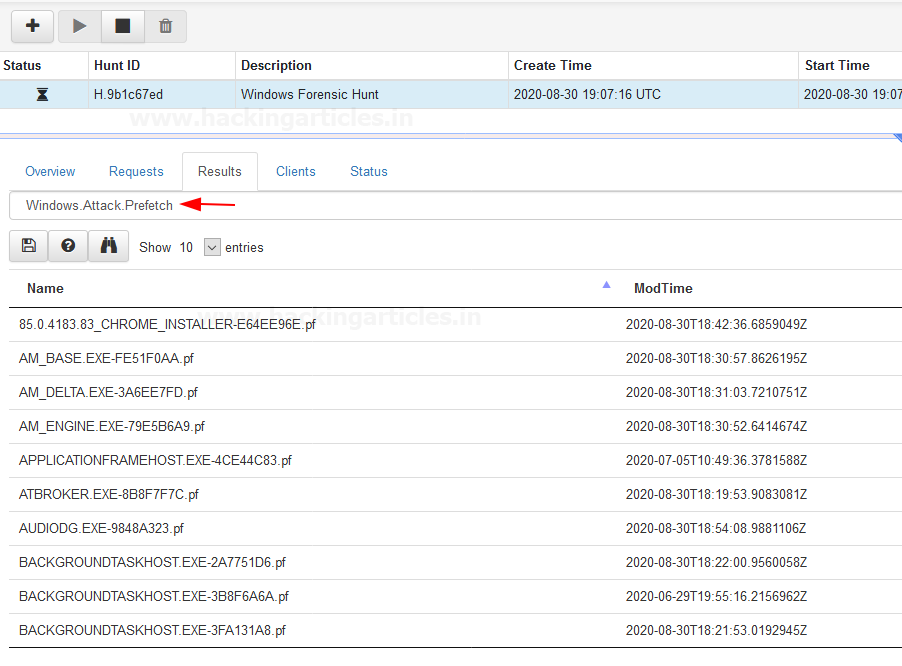
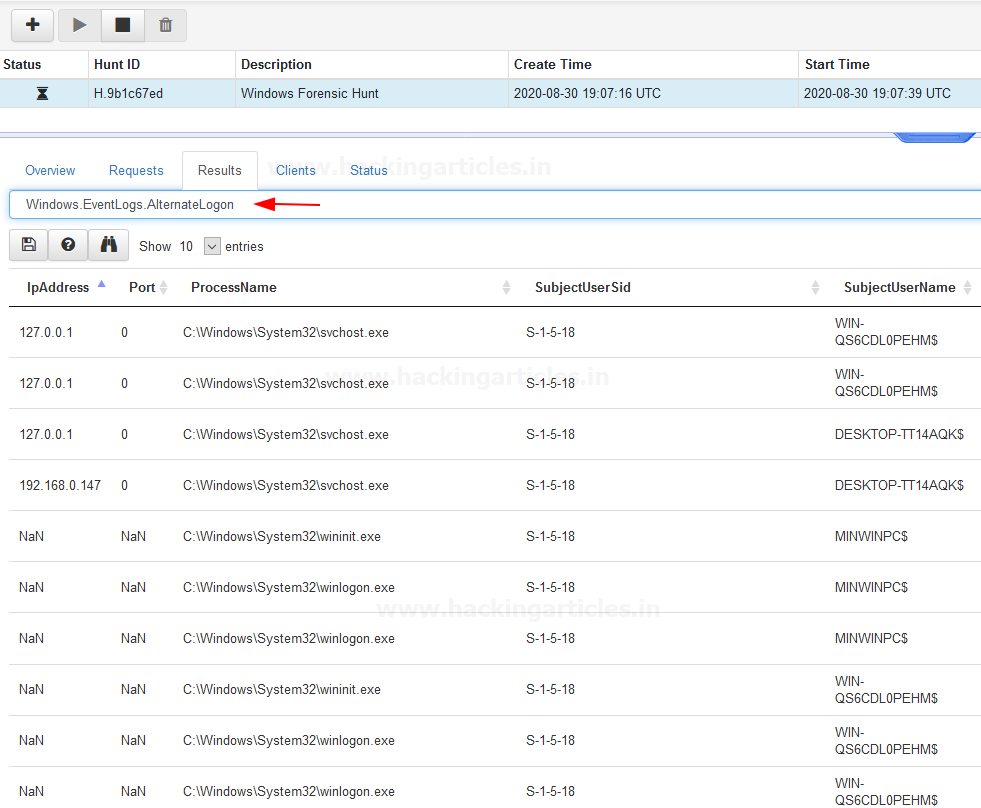
Let’s Begin some Forensics investigation
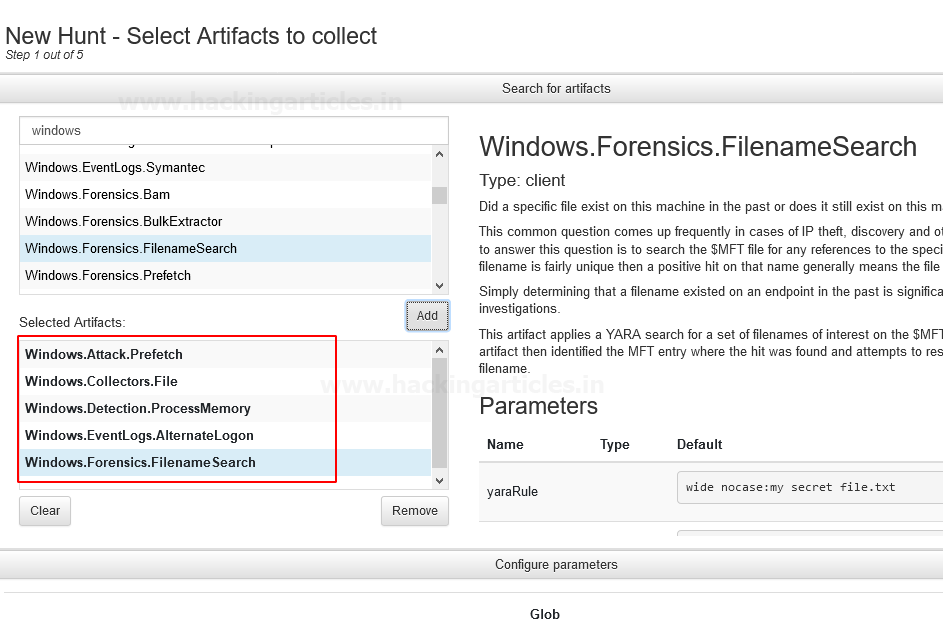
Will do it by adding some predefined windows artifacts here, I’m using
- Attack.Prefetch
- Collectors.File
- Detection.ProcessMemory
- EventLogs.AlternateLogon
- Forensics.FilenameSearch
Enter the Hunt Parameters or Hunt Description

And at the next screen, we have our Hunt results…. For example, if you want to see “Windows.Attack.Prefetch” select It form Results dropdown
Same if you want to see “Windows.EvemtLogs.AlternateLogon” select it from result dropdown and hit enter….
Similarly, you can Dig it much Deeper by adding as many artifacts as you need
Hang tight this is not enough!
You can follow part 2 to continue this post.
Author – Vijay is a Certified Ethical Hacker, Technical writer and Penetration Tester at Hacking Articles. Technology and Gadget freak. Contact Here
Part 2 please…it’s so much helpful
Excellent write-up. Look forward to Part 2