Threat Hunting: Log Monitoring Lab Setup with ELK
Elastic Stack is formerly known as the ELK Stack.
Elk Stack is a collection of free opensource software from Elastic Company which is specially designed for centralized logging. It allows the searching, analyzing, and visualization of logs from different sources. in this guide, we will learn to install Elastic Stack on ubuntu.
To configure ELK Stack in your Ubuntu platform, there are some prerequisites required for installation.
- Ubuntu 20.04
- Root Privileges
Table of Content
- ELK Stack components
- Install Java and All Dependencies
- Install and configure Elasticsearch
- Install and configure Logstash
- Install and configure Kibana
- Install and configure NGINX
- Install and configure Filebeat
- Routing Linux Logs to Elasticsearch
- Create a Log Dashboard in Kibana
- Monitoring SSH entries
ELK Stack components
- Elasticsearch: It is a restful search engine that stores or holds all of the collected Data.
- Logstash: It is the Data processing component that sends incoming Data to Elasticsearch.
- Kibana: A web interface for searching and visualizing logs.
- Filebeat: A lightweight Single-purpose Data forwarder that can send data from thousands of machines to either Logstash or Elasticsearch.
Install Java and All Dependencies
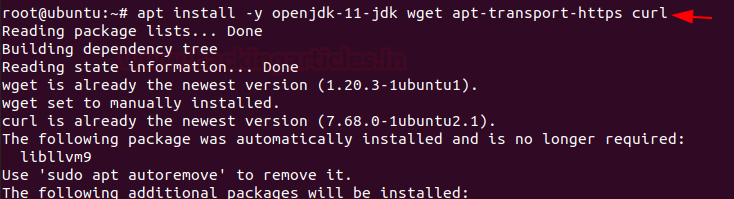
Elasticsearch requires OpenJDK available in our machine. Install Java using the below command along with the HTTPS support and wget packages for APT.
apt install -y openjdk-11-jdk wget apt-transport-https curl
Now, we are going to import Elasticsearch public key into APT. To import the GPG key enter the following command:
wget -qO - https://artifacts.elastic.co/GPG-KEY-elasticsearch | sudo apt-key add –

Add Elastic repository to the directory sources.list.d by using the following command :
echo "deb https://artifacts.elastic.co/packages/6.x/apt stable main" | sudo tee -a /etc/apt/sources.list.d/elastic-6.x.list

Install and configure Elasticsearch
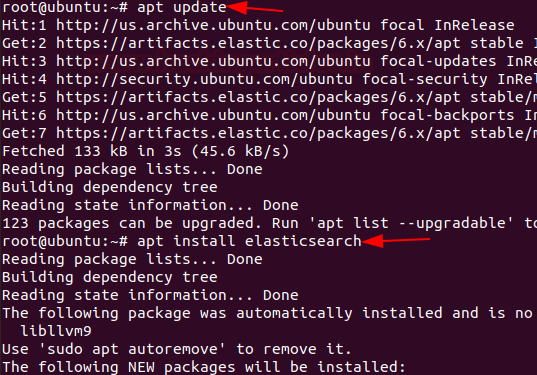
Update the system repository
apt update
Install Elasticsearch by using the following command:
apt install elasticsearch
Next, we configure Elasticsearch.
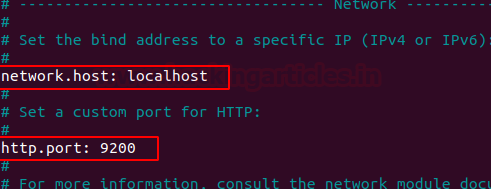
Elasticsearch listens for traffic on port 9200. We are going to restrict outside access to our Elasticsearch instance so that outside parties cannot access data or shut down the elastic cluster through the REST API. Now we’re going to do some modifications to the Elasticsearch configuration file – elasticsearch.yml.
Enter the following command:
nano /etc/elasticsearch/elasticsearch.yml
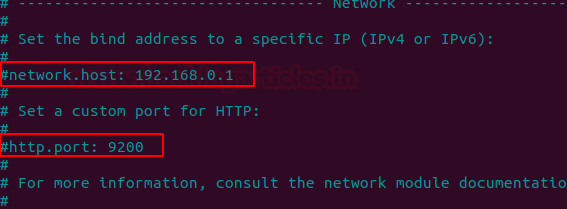
Find the line that specifies network.host attribute and uncomment it and add localhost as its value and also uncomment http.port attribute.
network.host: localhost
http.port: 9200
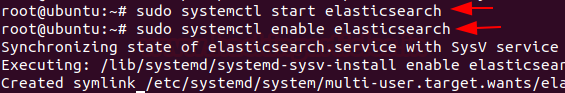
Now, start and enable Elasticsearch services.
systemctl start elasticsearch
systemctl enable elasticsearch
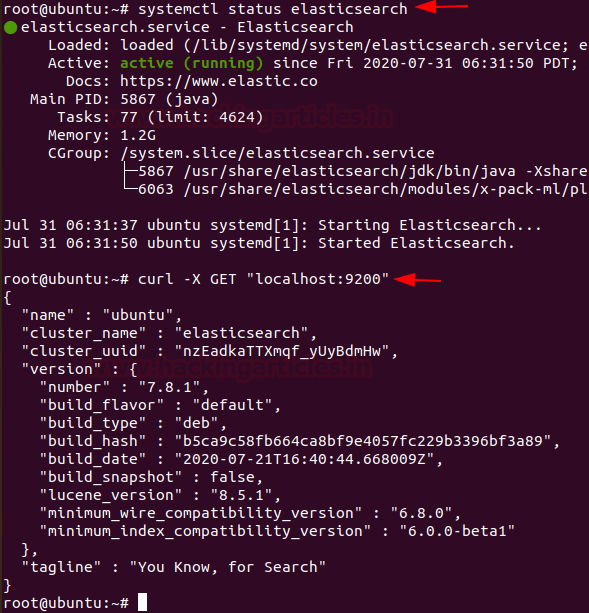
Let’s verify the status if Elasticsearch.
systemctl status elasticsearch
curl -X GET "localhost:9200"
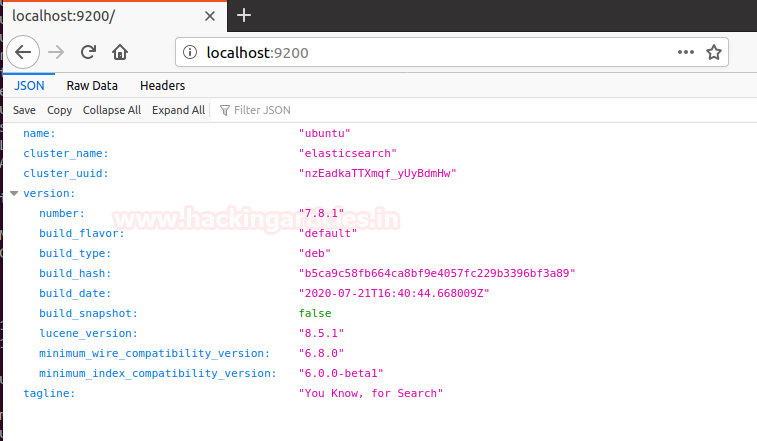
By default Elasticsearch is listening on the port 9200 you can also verify it on your web browser by pinging https://localhost:9200
Now Elasticsearch is up and running.
Install and configure Logstash
Logstash used to collect and centralizing logs from different servers using filebeat
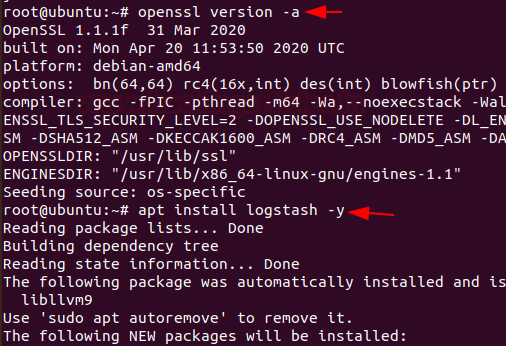
First Let’s confirm OpenSSL is running and then install Logstash by running following command:
openssl version -a
apt install logstash -y
Edit the /etc/hosts file and add the following line
nano /etc/hosts
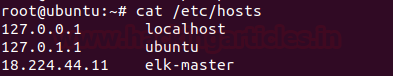
Where 18.224.44.11 is ip address of server elk-master.
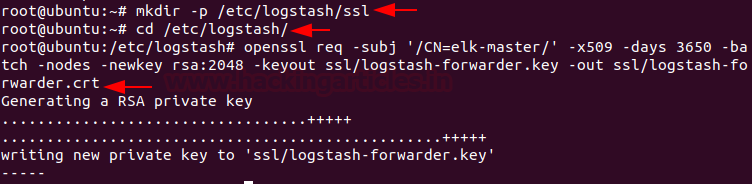
Let’s generate an SSL certificate to secure the log data transfer from the client Rsyslog & Filebeat to the Logstash server.
To do this create a new SSL directory under Logstash configuration directory and navigate into that directory generate an SSL certificate by running following command:
mkdir -p /etc/logstash/ssl
cd /etc/logstash/
openssl req -subj '/CN=elk-master/' -x509 -days 3650 -batch -nodes -newkey rsa:2048 -keyout ssl/logstash-forwarder.key -out ssl/logstash-forwarder.crt
Now, we are going to create new configuration files for Logstash named ‘filebeat-input.conf’ as input file from filebeat ‘syslog-filter.conf’ for system logs processing, and ‘output-elasicsearch.conf’ file to define Elasticsearch output.
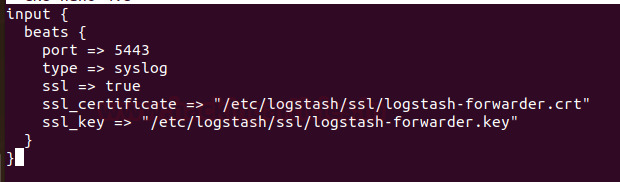
Navigate to Logstash directory create a file ‘filebeat-input.conf’ in conf.d directory by running command
cd /etc/logstash/
nano conf.d/filebeat-input.conf
and paste the following configuration
input {
beats {
   port => 5443
    type => syslog
    ssl => true
    ssl_certificate => "/etc/logstash/ssl/logstash-forwarder.crt"
    ssl_key => "/etc/logstash/ssl/logstash-forwarder.key"
  }
}
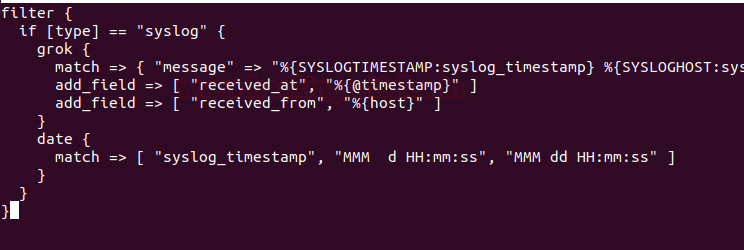
For the system log data processing, we are going to use a filter plugin named ‘grok’. Create a new conf. file ‘syslog-filter.conf in the same directory
nano conf.d/syslog-filter.conf
and paste the following configuration lines
filter {
  if [type] == "syslog" {
    grok {
      match => { "message" => "%{SYSLOGTIMESTAMP:syslog_timestamp} %{SYSLOGHOST:syslog_hostname} %{DATA:syslog_program}(?:\[%{POSINT:syslog_pid}\])?: %{GREEDYDATA:syslog_message}" }
      add_field => [ "received_at", "%{@timestamp}" ]
      add_field => [ "received_from", "%{host}" ]
    }
    date {
      match => [ "syslog_timestamp", "MMM  d HH:mm:ss", "MMM dd HH:mm:ss" ]
    }
  }
}
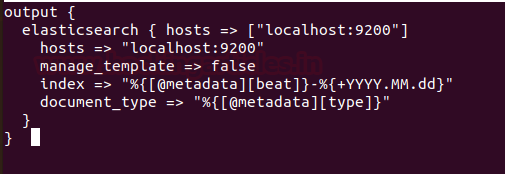
And at last create a configuration file ‘output-elasticsearch.conf’ for the output of elasticsearch.
nano conf.d/output-elasticsearch.conf
and paste the following configuration
output {
  elasticsearch { hosts => ["localhost:9200"]
    hosts => "localhost:9200"
    manage_template => false
    index => "%{[@metadata][beat]}-%{+YYYY.MM.dd}"
    document_type => "%{[@metadata][type]}"
  }
}
And at last, save and exit.
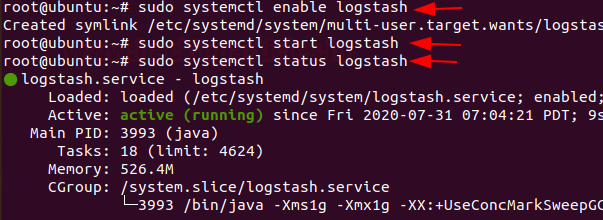
Now start, enable & verify the status of Logstash service.
systemctl start logstash
systemctl enable logstash
systemctl status logstash
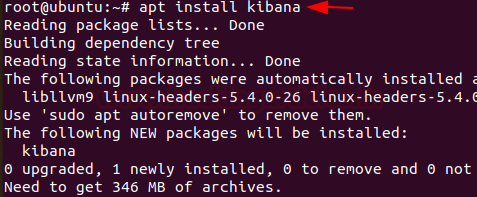
Install and configure Kibana
Install Kibana by using the following command
apt install kibana
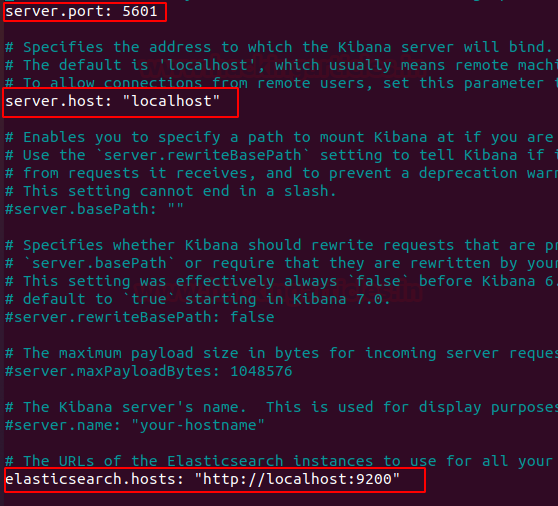
We are going to do some modifications to the kibana configuration file.
nano /etc/kibana/kibana.yml
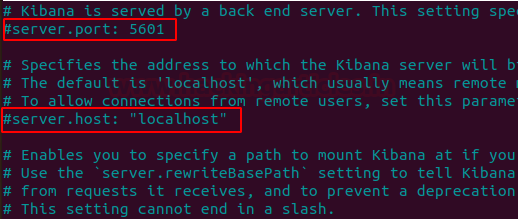
Locate and uncomment the following Attributes
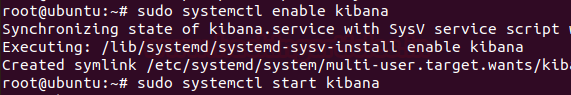
Now start & enable the kibana service:
systemctl enable kibana
systemctl start kibana
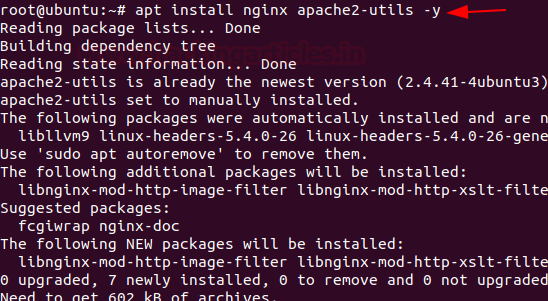
Install and configure NGINX
Install Nginx and ‘Apache2-utlis’
apt install nginx apache2-utils -y
Now, create a new virtual host file named Kibana.
nano /etc/nginx/sites-available/kibana
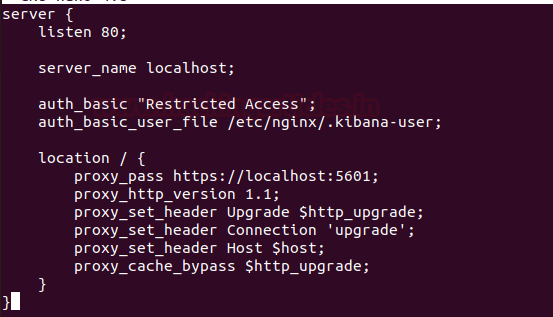
and paste the following configuration Into the file.
server {
    listen 80;
    server_name localhost;
    auth_basic "Restricted Access";
    auth_basic_user_file /etc/nginx/.kibana-user;
    location / {
        proxy_pass https://localhost:5601;
        proxy_http_version 1.1;
        proxy_set_header Upgrade $http_upgrade;
        proxy_set_header Connection 'upgrade';
        proxy_set_header Host $host;
        proxy_cache_bypass $http_upgrade;
    }
}
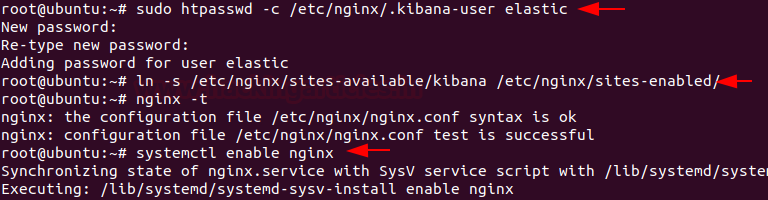
Let’s create authentication for the Kibana Dashboard and activate the Kibana virtual host configuration and test Nginx configuration after that enable & restart the Nginx service by using the following command.
sudo htpasswd -c /etc/nginx/.kibana-user elastic
ln -s /etc/nginx/sites-available/kibana /etc/nginx/sites-enabled/
nginx -t
systemctl enable nginx
systemctl restart nginx
Install and configure Filebeat
We’re going to configure filebeat data shippers on our elk-master server. This will be used to collect data from various sources and transport them to Logstash and Elasticsearch.
Download & Install filebeat by running the following command.
curl -L -O https://artifacts.elastic.co/downloads/beats/filebeat/filebeat-6.8.11-amd64.deb

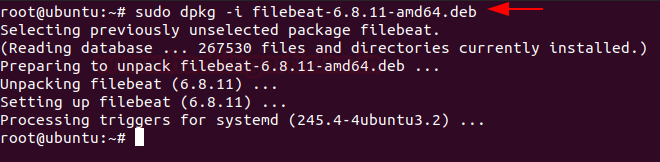
Let’s repackage the downloaded file by using the following command:
sudo dpkg -i filebeat-6.8.11-amd64.deb
Next, open the filebeat configuration file named ‘filebeat.yml’
nano /etc/filebeat/filebeat.yml
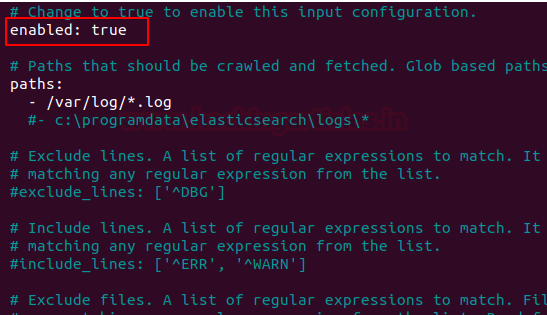
Edit the configuration file:
we’re going to use Elasticsearch to perform additional processing on data collected by filebeat. Therefore, Enable the filebeat prospectors by changing the ‘enabled’ line value to ‘true’.
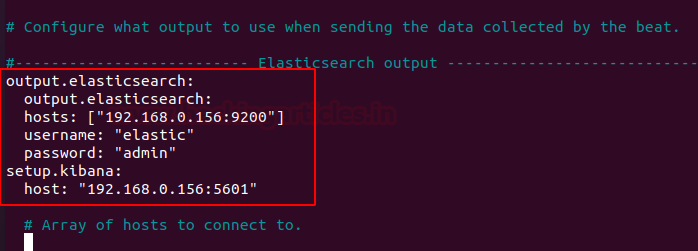
Next head to the Elasticsearch output section and add the following lines
output.elasticsearch:
hosts: ["192.168.0.156:9200"]
username: "elastic"
password: "123"
setup.kibana:
host: "192.168.0.156:5601"
Enable and configure the Elasticsearch module by running following command
sudo filebeat modules enable elasticsearch
Let’s start filebeat
sudo filebeat setup
sudo service filebeat start
And at last copy the Logstash certificate file – logstash-forwarder.crt – to /etc/filebeat directory by running following command:
cp /etc/logstash/ssl/logstash-forwarder.crt /etc/filebeat/
sudo service filebeat restart
To test ELK stack open your browser and browse your server ip address followed by port 5601
https://localhost:5601
Routing Linux Logs to Elasticsearch
We’re routing logs from rsyslog to Logstash and these logs transferred to Elasticsearch automatically
Routing From Logstash To Elasticsearch
Before routing logs from rsyslog to Logstash firstly we need to set up log forwarding between Logstash and Elasticsearch.
To do this we’re going to create a configuration file for Logstash. To create configuration file head over towards the directory /etc/logstash/conf.d and create a logstash.conf file
cd /etc/logstash/conf.d
nano logstash.conf
paste the following configuration into the logstash.conf file
input {
  udp {
    host => "127.0.0.1"
    port => 10514
    codec => "json"
    type => "rsyslog"
  }
}
# The Filter pipeline stays empty here, no formatting is done.
filter { }

# Every single log will be forwarded to ElasticSearch. If you are using another port, you should specify it here.
output {
  if [type] == "rsyslog" {
    elasticsearch {
      hosts => [ "127.0.0.1:9200" ]
    }
  }
}
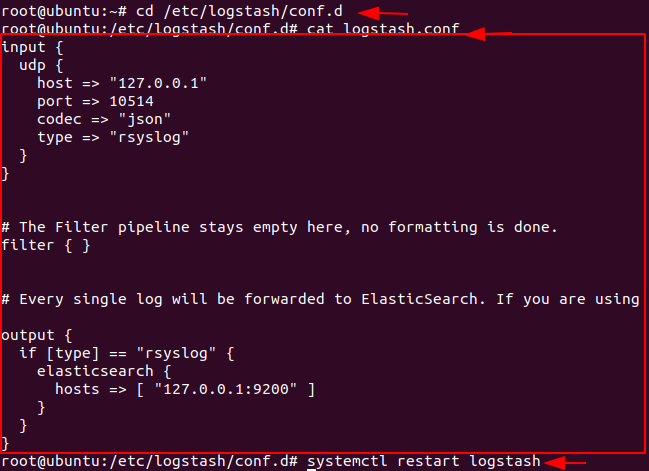
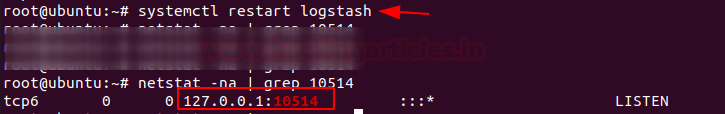
Restart the Logstash service.
systemctl restart logstash
Let’s check that everything is running correctly issue the following command:
netstat -na | grep 10514
Routing from rsyslog to Logstash
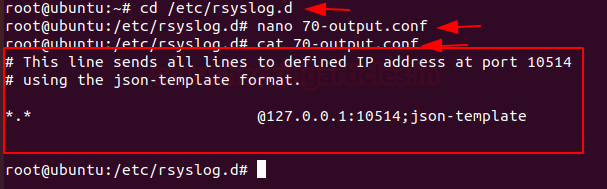
Rsyslog has the capacity to transform logs using templates in order to forward logs in rsylog, head over to the directory /etc/rsylog.d and create a new file named 70-output.conf
cd /etc/rsyslog.d
nano 70-output.conf
And paste the following configuration into the 70-output.conf file
# This line sends all lines to defined IP address at port 10514
# using the json-template format.
*.*                         @127.0.0.1:10514;json-template
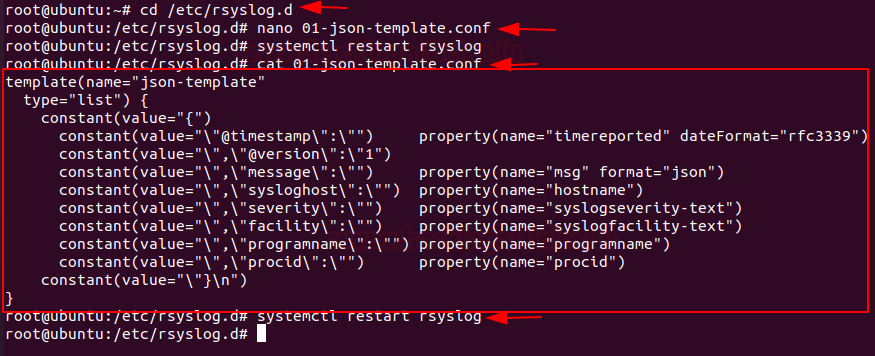
Now we have log forwarding, create a 01-json-template.conf file in the same folder
nano 01-json-template.conf
And paste the following configuration into the 01-json-template.conf file
template(name="json-template"
  type="list") {
    constant(value="{")
      constant(value="\"@timestamp\":\"")     property(name="timereported" dateFormat="rfc3339")
      constant(value="\",\"@version\":\"1")
      constant(value="\",\"message\":\"")     property(name="msg" format="json")
      constant(value="\",\"sysloghost\":\"")  property(name="hostname")
      constant(value="\",\"severity\":\"")    property(name="syslogseverity-text")
      constant(value="\",\"facility\":\"")    property(name="syslogfacility-text")
      constant(value="\",\"programname\":\"") property(name="programname")
      constant(value="\",\"procid\":\"")      property(name="procid")
    constant(value="\"}\n")
}
Restart rsyslog service and verify that logs are correctly forwarded into Elasticsearch.
systemctl restart rsyslog
curl -XGET 'http://localhost:9200/logstash-*/_search?q=*&pretty'
Note:- Logs will be forwarded in an index named logstash-*.
Create a Log Dashboard in Kibana
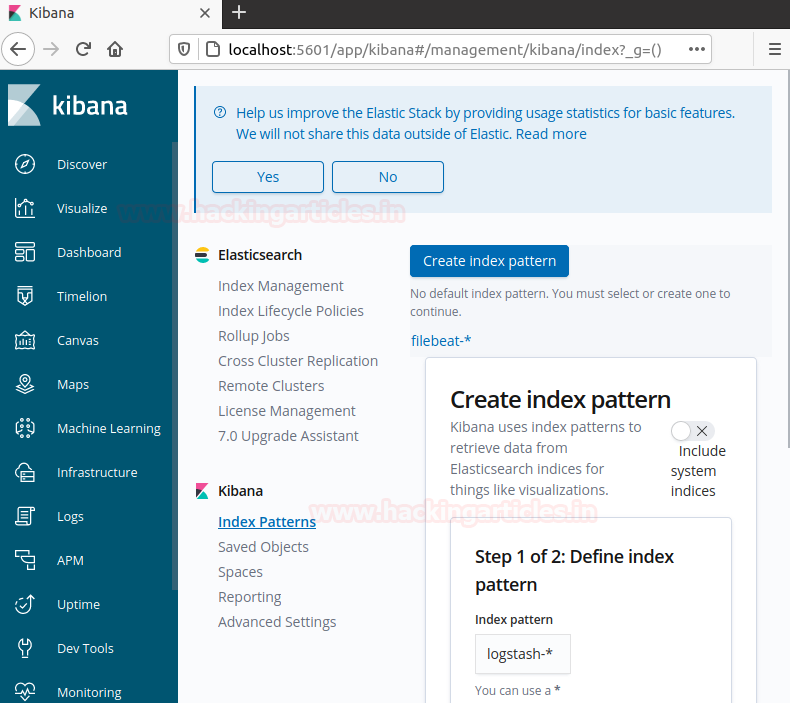
Open your browser and head over to https://localhost:5601 and you should see the following screen.
Go to the management section and create an index pattern called logstash-* and proceed for the next step.
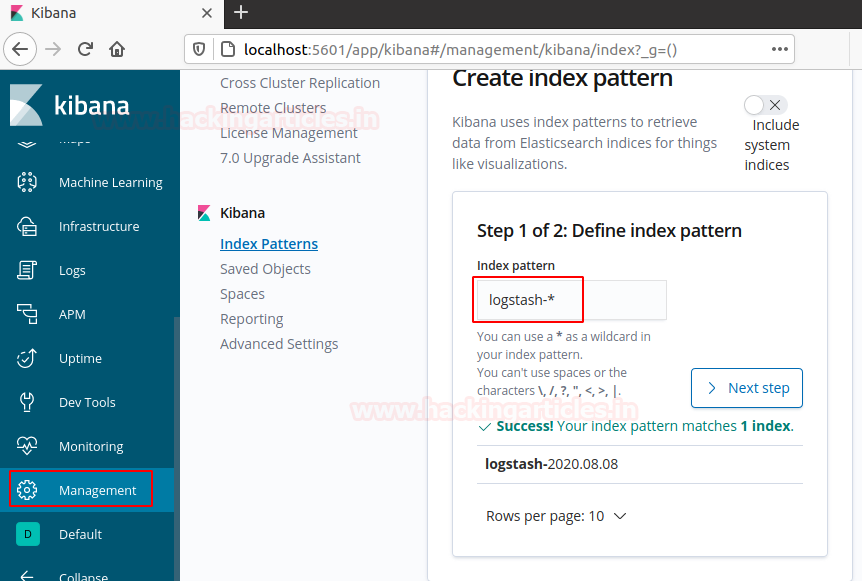
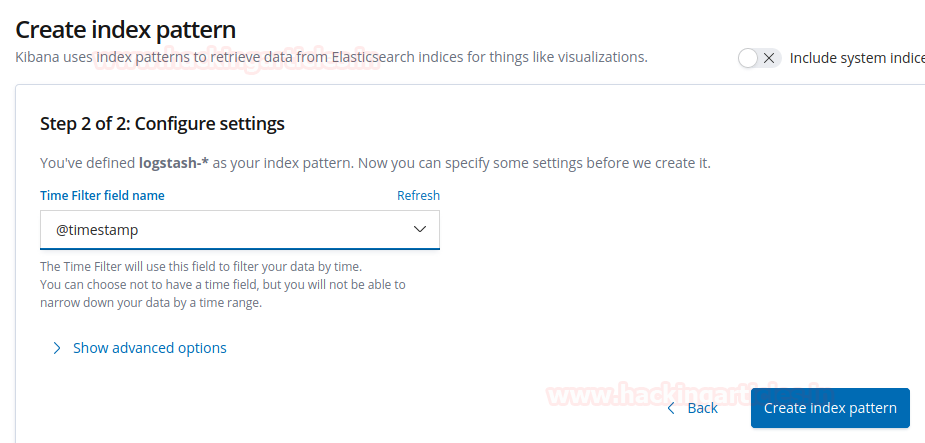
we’ve defined logstash-* as our index pattern. Now we can specify some settings before we create it. In the field of time filter field name choose @timestamp and create an index pattern
Monitoring SSH entries
This one is a little bit special, as we can go into the “Discover” tab in order to build our panel.
When entering the discover tab, select logstash-*
From there, in the fiterbar, put a query filter “programename:ssh*”.
Now we can see every log related to the SSHd service in our machine.
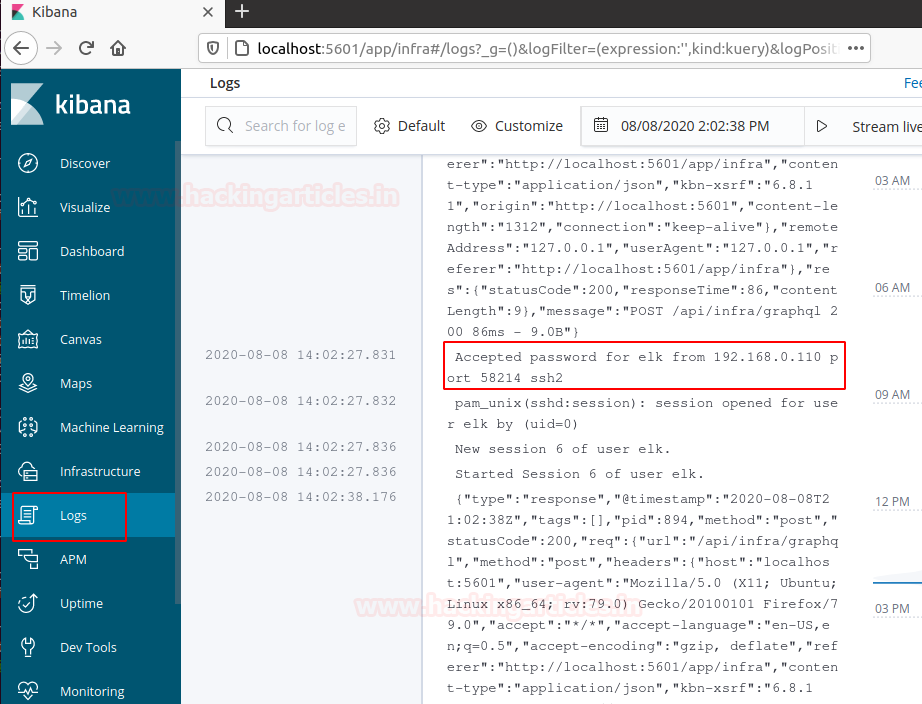
As we can see, now we have direct access to every log related to the SSHd service. we can for example track illegal access attempts or wrong logins.
Similarly, we can monitor various illegal access attempts or wrong logins like ftp, telnet etc…
For example, I took Telnet access to my server from a different machine.
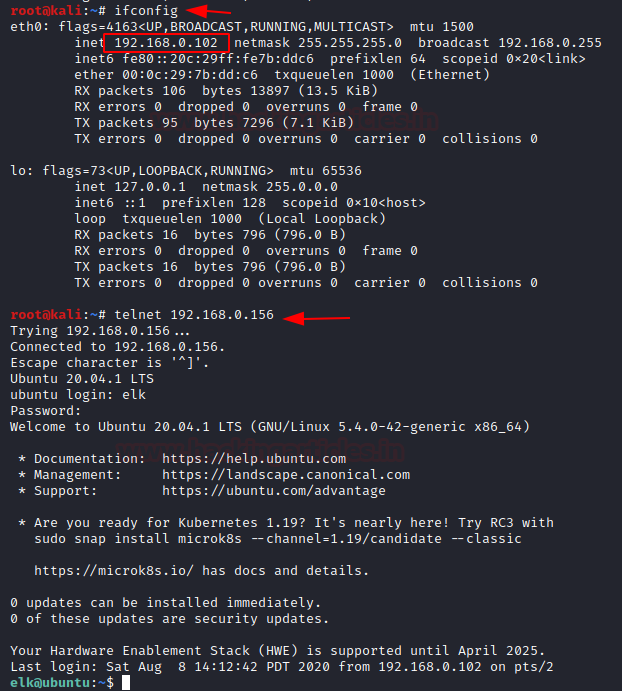
Let’s check what happens on the Kibana dashboard.
Hold tight!
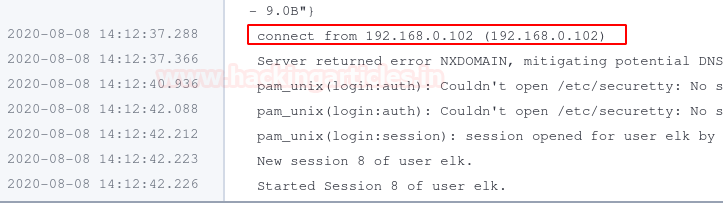
Nice! Now your panel is included in your dashboard.
Learn more on Threat Hunting from this Link.
Author – Vijay is a Certified Ethical Hacker, Technical writer and Penetration Tester at Hacking Articles. Technology and Gadget freak. Contact Here
need some threat logs to start hunting. do you have it? if yes, please send me link
Go for the article… in the last of this aarticle u are able to monitor threat logs. The first time you use a new instance of Kibana, there are a couple of setup steps you’ll need to do. Since Elasticsearch can store multiple different kinds of data at once, Kibana wants you to narrow it down to a particular set of data using a search pattern. For log monitoring go to management console and create a index and conifgure index with timestamp Once you have this set up you should be able to go to “Discover” and see a bit of data on display.
Thank you so much.
Hi RAJ CHANDEL,
have you any idea how much memory and disk space is necessary to install and let running the monitoring activity with all these applications ?
Thanks for your content!
Atleast 4gb ram with 2cpu processor’s.
Guys how to download this article
This is by far the best article around Elasticsearch I’ve even seen and I have researched for months. This shit should be paid and I want to thank you for putting this out here for everyone’s benefit. You’ve put so much man hours on this!
i can’t find logstash-* in kibana dashboard indexes. how to add it, How can i moniter my nmap scanning by elk ?