SIEM: Windows Client Monitoring with Splunk
In this guide on SIEM Windows Client Monitoring with Splunk, we focus on setting up a Splunk Universal Forwarder on a Windows machine. This setup enables the collection and analysis of Windows logs, providing insights into system activities and potential security events. By forwarding these logs to Splunk Enterprise, organizations can enhance their security posture and ensure comprehensive monitoring of their Windows clients.
In our previous article, we have covered with Splunk master server setup with a brief demonstration of Dashboard setup or Log monitoring you can visit that article from here. Once done with a complete server setup we need to focus on how to bring the logs from the network environment into Splunk for indexing. We are going to import data from the client machine or a network of 100 or 1000’s of pc into the Splunk server that we set up previously and what else needs to be indexed.
Now let us see how to forward the logs or Data from client-server to Splunk Enterprise.
SIEM: Log Monitoring Lab Setup with Splunk
Table of Content
- Prerequisites
- Configure a receiving on Splunk Enterprise
- Configure the receiver using the command line
- Configure receiver using a configuration file
- Environment
- Download and install Universal Forwarder
- Configure Universal Forwarder to send data Splunk Enterprise
- Windows Log Monitoring
- Threat monitoring
Prerequisites
To configure Splunk universal Forwarder on your client-server, there are some prerequisites required for installation.
- Windows, Linux systems, or cloud servers with admin access.
- Splunk Universal forwarder
- Attacker: Kali Linux
Configure a Receiving on Splunk Enterprise
On your Splunk Dashboard, you must configure an indexer to receive data before you can send data to it. If you did not do this, then your data not going anywhere.
Use the Splunk web interface to configure a receiver for Splunk-to-Splunk (S2S) communication. To do this follow the below steps
- Log into Splunk web using your credentials
- On Splunk web go to Settings > Forwarding and Receiving

Select “configure Receiving”.

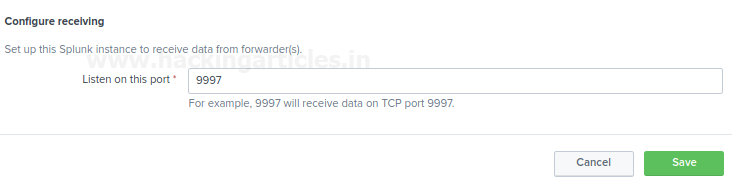
Verify the existing ports are open or not. If there are no ports available, then add a port also you cannot create a duplicate receiver port. The most suitable receiver port on indexers is port 9997.
Select “New receiving port.”

- Add a port number and save and do not forget to verify that port is available or not reserved to any other service or instance.
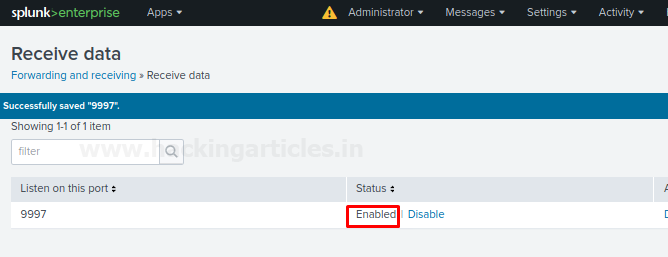
Check the status for receiving port, it should enable for listening to the traffic.
Configure a receiver using the command line
Use the command-line interface with Admin privilege in windows 10 or terminal with root user to configure a receiver for S2S communications. To do this follow the steps as described below.
- Open a shell with admin rights or the terminal with root user
- Change the path to $SPLUNK_HOME/bin
- (For Linux) Type:
./splunk enable listen 9997 -auth admin:password
- (For windows) Type:
Splunk enables listen 9997 -auth admin: password
- Restart Splunk for the changes to take effect by going into Splunk web interface setting > server control > restart Splunk.
or
Configure a receiver using a Configuration file
For windows
Configure inputs.conf file for S2S communication:
- Open a shell prompt
- Change the path to $SPLUNK_HOME/etc/system/local
- Edit the conf file.
- Edit the input.conf file with [ splunktcp ]stanza and define the receiving port. Example:
[splunktcp://9997]
disabled = 0
- Save the file.
- Restart Splunk to take effect of the saved changes.
For Linux Environment
Open the Splunk forwarder directory wherever it installs and locate the file named input.conf and make changes as described above or as per your requirements.
In this blog, we will target to install a Splunk Universal Forwarder on a Windows Machine or server. You can download Splunk forwarder by following the below link.
https://www.splunk.com/en_us/download/universal-forwarder.html
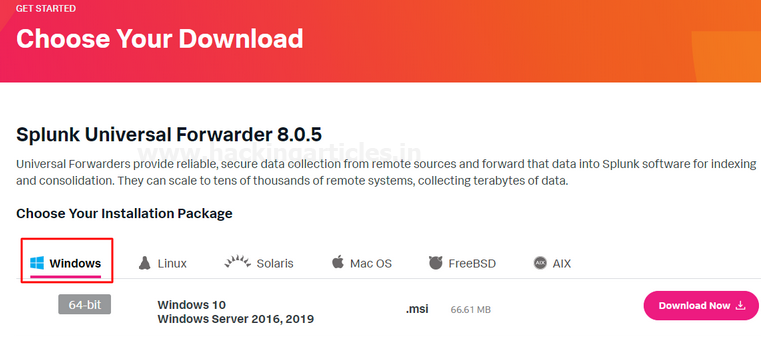
Choose your installation package
- Create a Splunk Account and download Splunk universal forwarder for Windows version by the given above link.
- We choose Windows 10 64 bit .msi Package for the installation in windows. You can choose it as per your system requirements.

Or also for Linux systems, you can go with the options are available to download on the Splunk website by drop down the option Linux then select and download package as per your choice as shown below.

Install Splunk Universal Forwarder on Windows 10
To install Universal forwarder into your operating systems, follow the steps as described below:
Visit the Splunk official website and select and download universal forwarder for Windows 10 .msi file. It will download a Zip file into your downloads as shown below.
When it gets downloaded open it and start the installation process and accept the license agreement then go to customize options as shown below:

Further, select the installation directory wherever you want to install it as shown below

Further, it will ask you to for an SSL certificate for the encryption with your encryption key if you do not have the SSL certificate then don’t worry forwarded Splunk data will still be encrypted with the default Splunk certificate all you need to do is go with Next option.

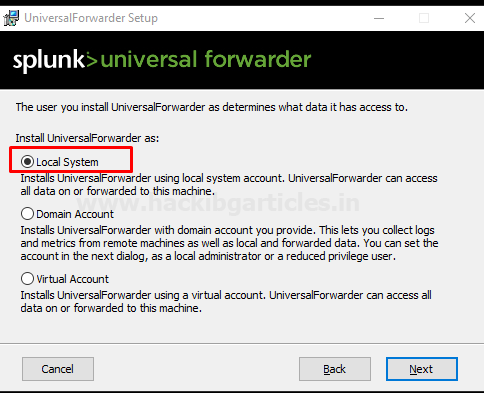
On the next dialogue you will have two options:
- Local System. If you specify the Local System user during the installation process, the universal forwarder can access all your data on that is available on your local system or forwarded to this machine.
- Domain account. This option installs the forwarder as the Windows user specifies this lets you collect logs and metrics from remote machines as well as local and forwarded data. You can set the permissions of account in the next dialogue, as a local administrator or a reduced privilege user It does not collect data from resources that the Windows user does not have access to.
So, we go with the option Local Systems and Install the forwarder as a Local account to do any of the following:
- Read Event Logs remotely
- It Collects all your system performance counters remotely
- Read network shares for log files
- It can Access the Active Directory schema, using Active Directory monitoring if you select it
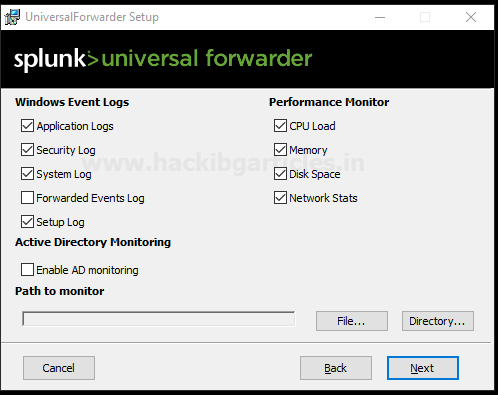
Then, it will ask you to select the applications or log files that you want to forward to Splunk Enterprise or receiver and then proceed with the next option as shown below.
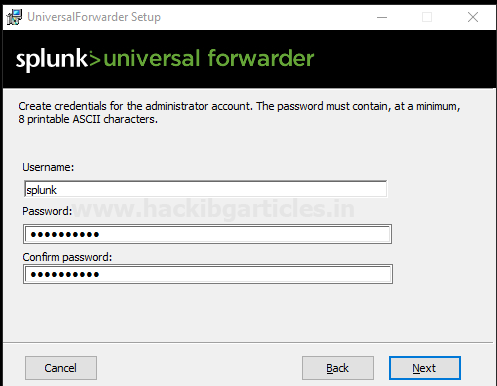
In the next dialogue, it will ask you to create credentials for the administrator account to encrypt all your files on Splunk Enterprise.
Configure your forwarder as a deployment server
On the next dialogue, it will be (optional) to configure your forwarder as a deployment server if you choose it then enter the hostname or IP address and management port for your deployment server and click next
In my case, I will leave it blank and prefer to go with the next option.
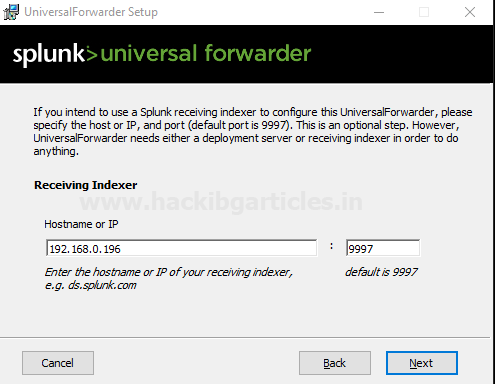
On the next dialogue setup Receiving indexer by entering the Hostname or IP and port as shown below
And then finally select option Install it will install Splunk forwarder in your windows environment
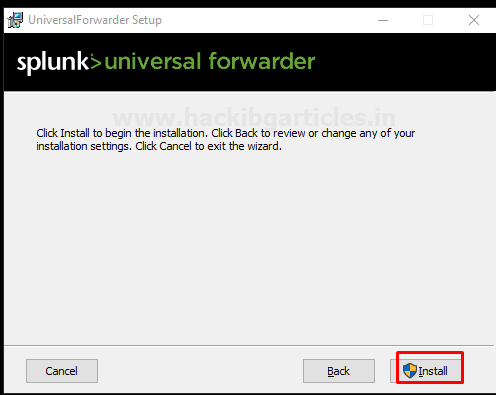
After that finish, the installation process.

Let’s verify the output.conf file to check is it forwarded to the Receiver or not.
To do this follow the steps as described below.
Go to file manager and open the directory where Splunk Universal forwarder installed.
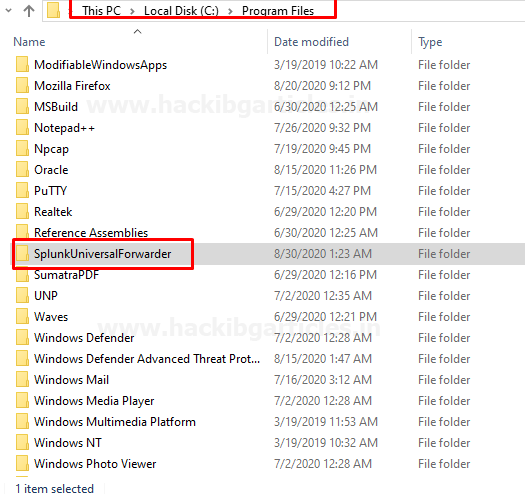
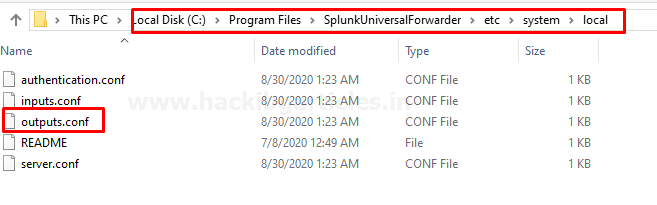
Open the file SplunkUniversalForwarder file and then open the output.conf file it will be found in under etc > system > local
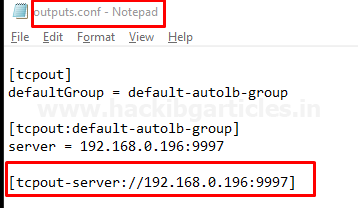
By opening it we can verify it either it is redirected to the correct IP or not as entered during the installation process if not you can make changes by editing it.
Configure Universal Forwarder to Send Data to Splunk Enterprise
Open CMD as Admin privilege and follow the steps described below:
cd c:\Program Files\SplunkUniversalForwarder
cd bin
splunk add-forward-server 192.168.0.196:9997
splunk enable eventlog system
splunk restart

Congratulations! You have successfully added Windows as a client
Let’s check what happens to the Splunk GUI interface is it added or not

As you can see our client is successfully added
Now search your client into Search and reporting application by simply running a query index=”main”

Windows Log Monitoring
Let’s check it shows or not suspicious activity happened on our client end
To do this I m going take RDP session of my client

Now I have an RDP session of my Client let’s check what happens on Splunk web
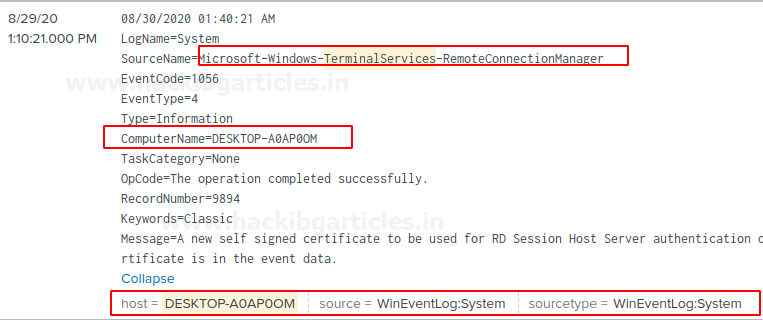
Whoa! It works 😊
Great!
Now you can Dig down deeper it with running search Queries.
Threat Monitoring
Let’s monitor what illegal or suspicious activity happens on your client end or server
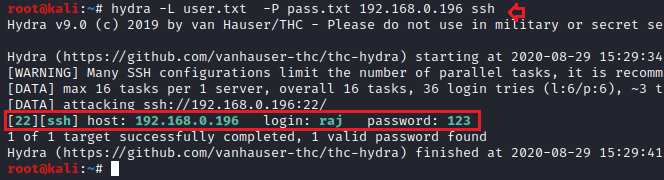
To do this I m going to perform a brute-force attack with the help of an Attacker machine: Kali Linux
To perform this attack run the following command below.
hydra -L user.txt -P pass.txt 192.168.0.196 ssh
where 192.168.0.196 is my client-server IP
Let’s check what happens to Splunk web
hold tight! It’s gonna a little bit special
Run a Query in the Application search and Reporting “sshd: session” and then see
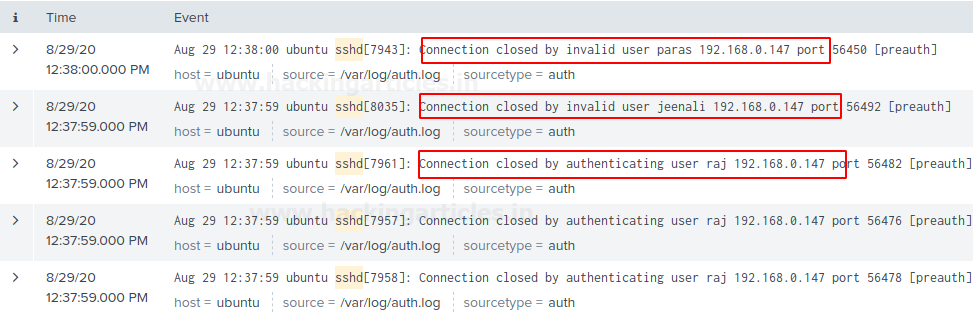
Owsm! AS we can see it have multiple invalid logins Attempts of invalid user
Now you can monitor your whole Environment by using these steps.
Let’s end here.
Author – Vijay is a Certified Ethical Hacker, Technical writer and Penetration Tester at Hacking Articles. Technology and Gadget freak. Contact Here
Hi,
Thank for useful article. I have a question for you. What is it purpose Virtual Account? Could you explain diffrences (domain account,local account etc. ) ?
Thanks