SIEM: Log Monitoring Lab Setup with Splunk
Splunk Inc. is an American public multinational corporation based in San Francisco, California, that produces software for searching, monitoring, and analyzing machine-generated big data via a Web-style interface.
Splunk (the product) captures, indexes, and correlates real-time data in a searchable repository from which it can generate graphs, reports, alerts, dashboards, and visualizations.
Table of Content
- What is Splunk
- Splunk Features
- Splunk Architecture
- Prerequisites
- Splunk Environment
- Download and Install Splunk
- Adding a task
- Creating a Dashboard
- Log Monitoring
What is Splunk
Splunk is a software that is used to search, and analyze machine data generated by various CPU running on web or local servers, IoT devices, mobile apps, sensors, or data created by the user. It completes the needs of IT infrastructure by analyzing the logs generated by systems in various processes in a structured or semi-structured format with proper data modelling and then it allows users to create Reports, Alerts, Tags, and Dashboards on these data.
Splunk Features
- Data searching: – searching in Splunk involves the pattern of creating metrics or indexes on Dashboards.
- Data ingestion: – Splunk ingest data in various formats like XML, JSON, and unstructured machine data such as logs of CPU running on web servers.
- Data Indexing: – Splunk auto index the ingested data of various machines for the faster searching on various conditions
Alerts: – Splunk alert used for triggering emails or other feeds when some unusual suspicious activity found in data is being analysed.
Dashboards: – it shows the search results in the form of pivots, area mapping, pie charts, reports, etc.
Splunk Architecture
There are three main components of Splunk: –
- Splunk Forwarder
- Splunk Indexer
- Splunk Head
Prerequisites
To configure Splunk in your Ubuntu platform, there are some prerequisites required for installation.
- Ubuntu 20.04.1 with minimum 4GB RAM and 2 CPU
- SSH Access with Root Privileges
- Firewall Port: – 8000
Splunk Environment
In this blog, we will target to install an enterprise version that is available free for 60 days with all features enabled. You can download Splunk by following the link.
Linux version
Create a Splunk Account and download Splunk for Linux version by the given above link. We choose .deb Package for the installation in Ubuntu.

We can directly install it via terminal by copying wget snippet

Download and install Splunk
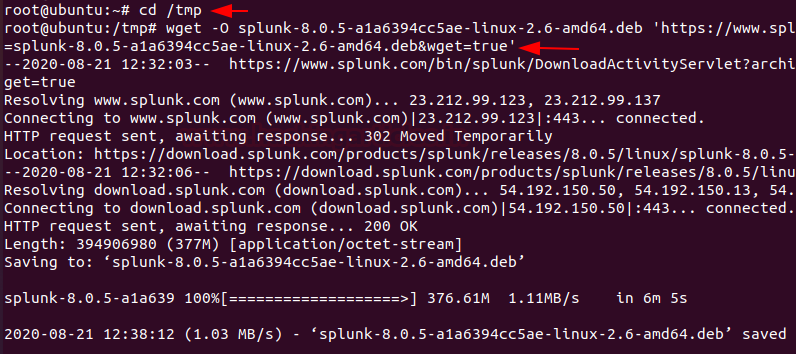
Now, Hit the terminal and download the Splunk into the tmp directory by entering the following command.
cd /tmp
wget -O splunk-8.0.5-a1a6394cc5ae-linux-2.6-amd64.deb 'https://www.splunk.com/bin/splunk/DownloadActivityServlet?architecture=x86_64&platform=linux&version=8.0.5&product=splunk&filename=splunk-8.0.5-a1a6394cc5ae-linux-2.6-amd64.deb&wget=true'
Next, we run the dpkg command to extract and install the Splunk server. To extract .deb package enter the following command
dpkg -i splunk-8.0.5-a1a6394cc5ae-linux-2.6-amd64.deb

Secondly, we need to create the init.d script so we can easily start or stop Splunk service. Change your binary directory at /opt/splunk/bin/ and run the following command to start the Splunk with system boot.
cd /opt/splunk/bin/
./splunk enable boot-start

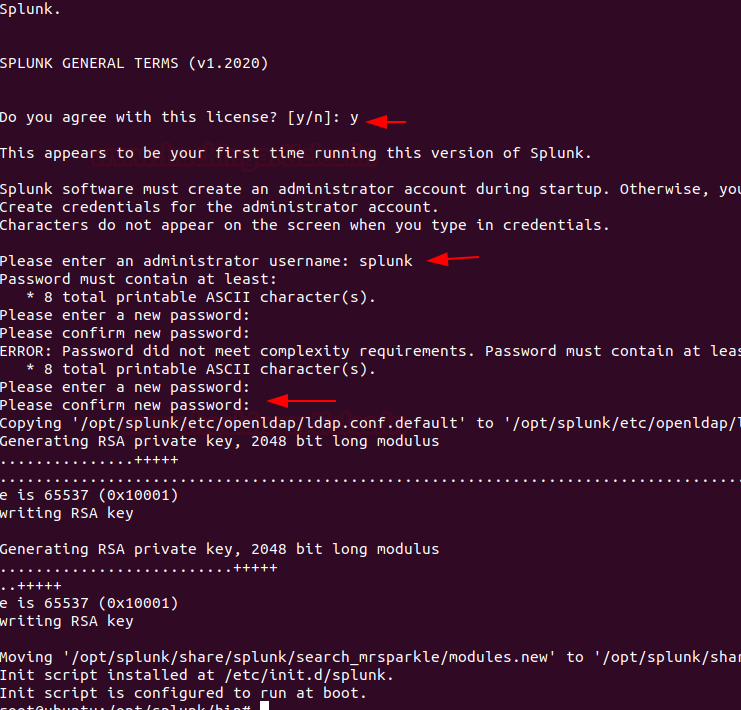
During this process press the spacebar to go through the license agreement and then type “Y” to accept it and then provide the username and password that you created on the official website of Splunk. Finally, we can start Splunk service with the below argument.
service splunk start
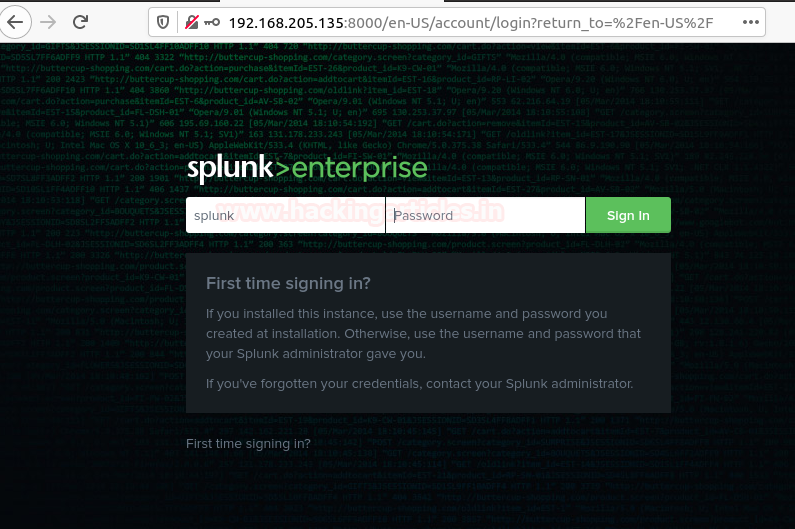
Now, you need to make sure port 8000 is open on your server firewall and then you can access Splunk on web interface at
http://server-Ip:8000/
http://server-hostname:8000
And then, enter the login credentials that you created during the installation process to access the GUI interface. Once you logged in then you will have your Splunk Dashboard ready to set fire on the logs 😊.
Adding a task
On the Splunk web interface, there are various categories listed over on the homepage you can choose your own to start Splunking. I’m adding an example for a task which is been added to the Splunk system. My task is to add or forward system logs to Splunk dashboard.
To forward logs to Splunk monitoring console just open the terminal and hit the following commands in the Splunk installed directory with the below arguments.
cd /opt/splunk/bin
./splunk add forward-server 192.168.205.135:9997 -auth splunk:Splunk@123
./splunk add monitor /var/log -sourcetype linux_logs -index remotelogs
./splunk restart

And then open Splunk search and reporting console and then run a query in the search bar.
index=remotelogs * host-ubuntu
You can also directly add this task by your Splunk Dashboard by following the below steps.
Step 1.
Fire up the Splunk web interface on your favourite browser and choose the “Add Data” option to start with.

Step 2.
The “Add Data” opens up with three options: Upload, Monitor, and Forward each option have self-explanatory with a short description. Our task is to monitor system logs we go with the option of “Monitor”.

In the monitor option, there are four categories as shown below
Files & Directories: To monitor files and folders
HTTP Event Collector: To Monitor Data streaming over HTTP
TCP/UDP: To monitor network Traffic over TCP/UDP ports
Scripts: To monitor Scripts and commands
Step 3.
As per our purpose we choose and go with the “Files & Directories” option.

And then we are going to browse the path where system logs are stored.

Now, we’re going to browse the exact path /var/log that’s from the server to monitor. Once you had done then select the next option.

After selecting the system files to monitor select the next option.

Also, you can whitelist or blacklist specific directories that you don’t want to monitor on a given dialogue box and then review your settings and hit submit button.

Congrats! Finally, you have successfully added the task to the Search & Reporting console now Start Searching.

Step 4.
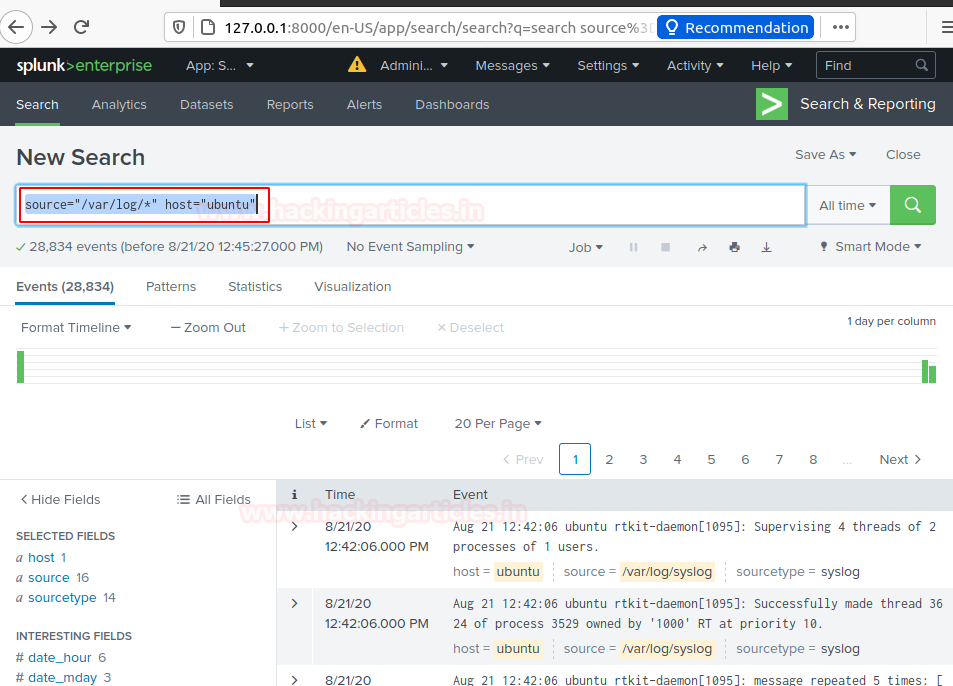
Now you’ve successfully added data source to Splunk for monitoring. You can search and monitor logs file as required just run the search query
source="/var/log/*" host="ubuntu"
Creating a Dashboard
And then now you can save these logs directory on your dashboard or also you can create an alert that is used for triggering emails or other feeds when some unusual suspicious activity found in data is being analysed.
To add this search and reporting console on your Dashboard simply follow the steps as described below.
Step 5.
Just locate “Save As” option on above of the Search & Reporting console and select “Dashboard Panel”

By selecting option Dashboard panel, it will prompt a Save As panel. Enter the Title of Dashboard panel and descriptions then save it.

Great! You have successfully created your dashboard panel. Now you can directly monitor your system logs by heading system logs under Dashboards panel.

Just select options available on your dashboard that you want to monitor in my case I’m watching the server logs that I saved in my dashboard. Now You can watch as many files of your server by simply adding it into the dashboard panel.
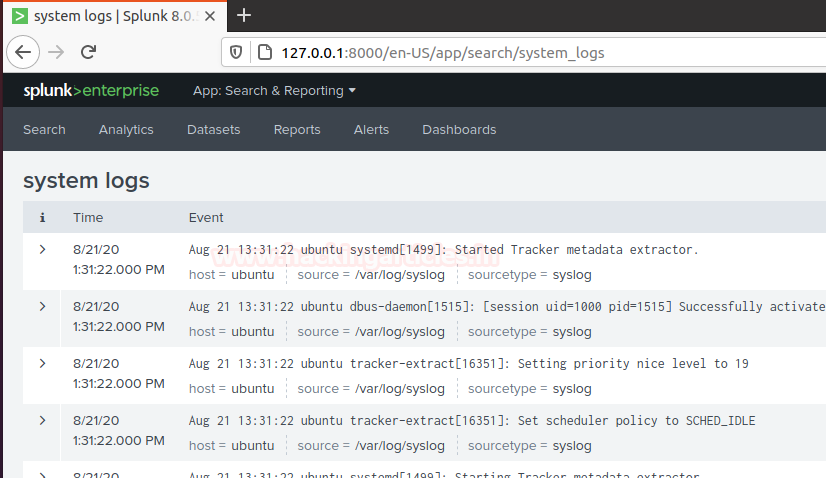
Log Monitoring
This one is a little bit special, as we can go into the “Dashboard” tab select the options that you want to monitor
For example, I’m going to take access to my server by different protocol’s as described below
- SSH
- Telnet
- Vsftpd
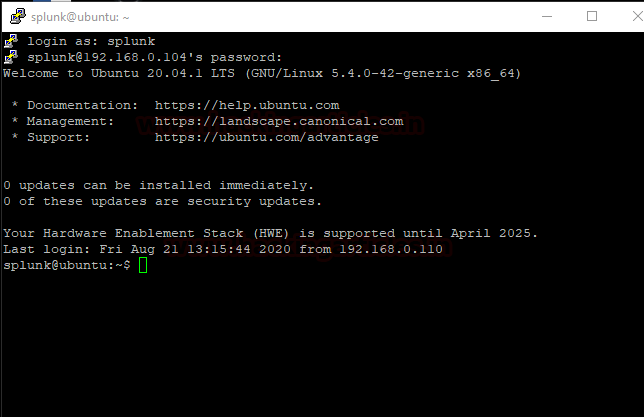
SSh
I use putty to take SSH access to my server machine

After setting host or port open the SSH prompt login into the server
After getting the access of the server get back to your dashboard and narrow down the logs to SSH on the server by running a query sshd.
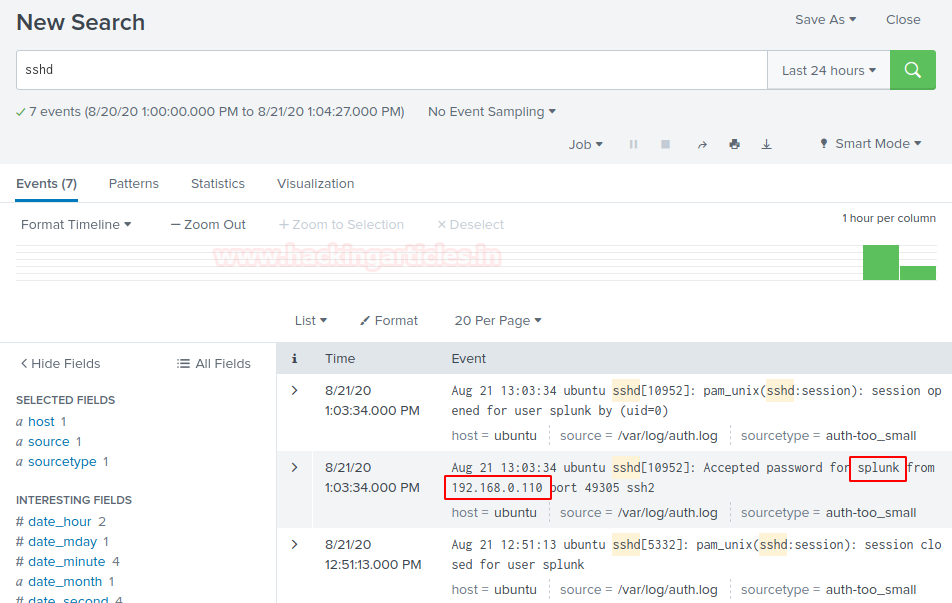
Now, we can see SSH access of the server machine in Dashboard under saved panel named system logs.
Telnet
I used the same puttygen to take telnet access of my server machine use your credentials to log in to your server.

Let’s check what happened to the Splunk dashboard. After getting the access of the server get back to your dashboard and narrow down the logs to telnet on the server by running query telnet.
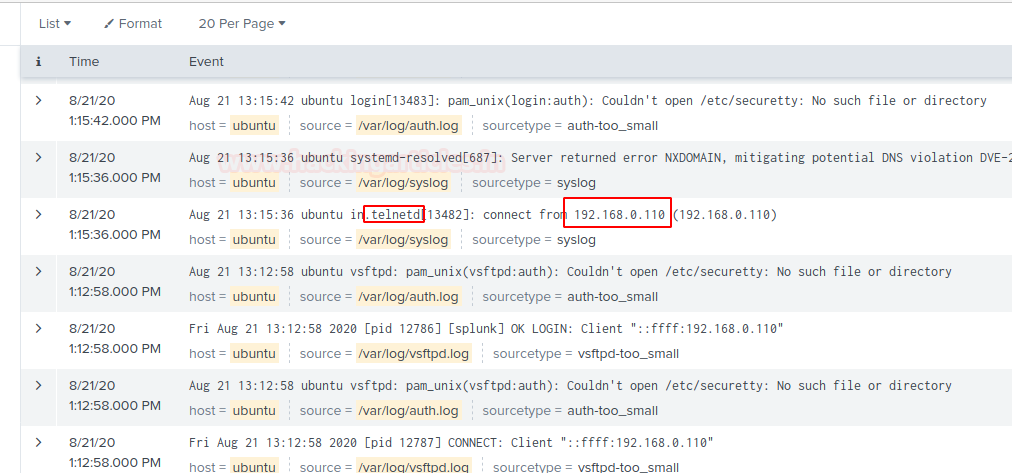
Now, we can see Telnet access logs of the server machine in Dashboard under the same panel.
Hang on! This is not enough.
Vsftpd
I took the vsftpd access of my server machine by using winscp or you can use your desired applications.
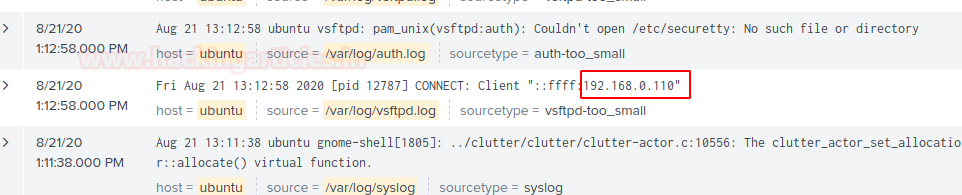
Narrow down your search by running a query vsftpd and then successfully you will be able to see your server vsftpd logs. You can run more search queries to drill down it deeper.
The more will be discussed in part 2.
Coming soon!
Author – Vijay is a Certified Ethical Hacker, Technical writer and Penetration Tester at Hacking Articles. Technology and Gadget freak. Contact Here