Memory Forensics using Volatility Workbench
Volatility Workbench is a GUI version of one of the most popular tool Volatility for analyzing the artifacts from a memory dump. It is available free of cost, open-source, and runs on the Windows Operating system. You can download it from Here.
You can refer to the previous article Memory Forensics: Using Volatility from here,
Table of Contents
- Features of Volatility Workbench
- Volatility Commands
- Hunting rootkits and malicious code
- Malfind
- Psxview
- Timers
- Getsids
- Cmdscan
- Consoles
- Privs
- Envars
- Verinfo
- Memmap
- Vadinfo
- Vadwalk
- Vadtree
- Iehistory
- Modules
- SSDT
- Driverscan
- File Scan
- Mutant scan
- Thrdscan
- Netscan
- Hivescan
- Hivelist
- Printkey
- Hashdump
- Lsadump
- Shellbags
- Getservicesids
- Getservicesids
- Dumpregistry
- Mbrparser
- Mftparser
Features of Volatility Workbench
- A forensic investigator does not have to worry about remembering the parameters of the command line.
- It has made it easier to store dump information to a file on disk.
- There is a drop-down list that contains the commands and its brief description.
- It records the time stamp of the commands you previously executed.
Download the tool and run it. Now choose the dump file you previously created and select the profile of the image you created, which you can use in place of the imageinfo command. Now click on Refresh Process List, and you can run all the commands.
Hunting rootkits and malicious code
It tends to run a scan on the memory dump and looks around for the presence of a rootkit or a malicious code that would not be easily seen in the system but could be running in the background.

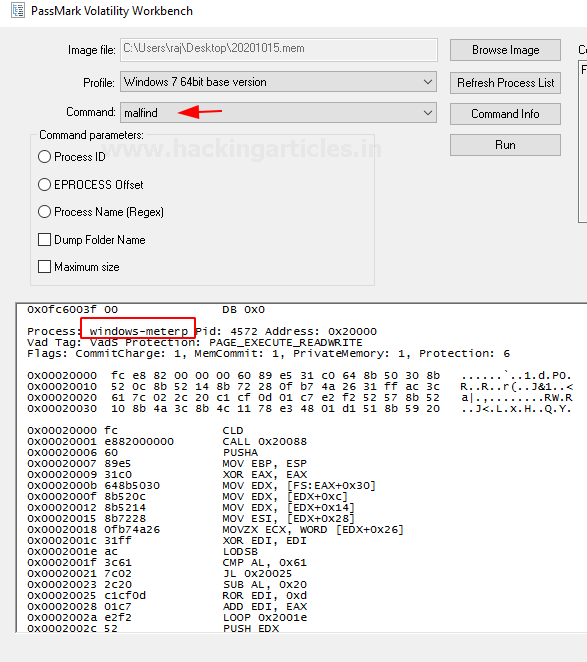
Malfind
It is a command which helps in finding a hidden code or a code that has been injected into the user’s memory. It doesn’t generally detect the presence of a DLL in a process but instead locates them.
psxview
This command usually helps in discovering any hidden processes in the plugin present in the memory dump.

Timers
It displays the timer of the kernel and all the associated timers present in the memory dump of the system.

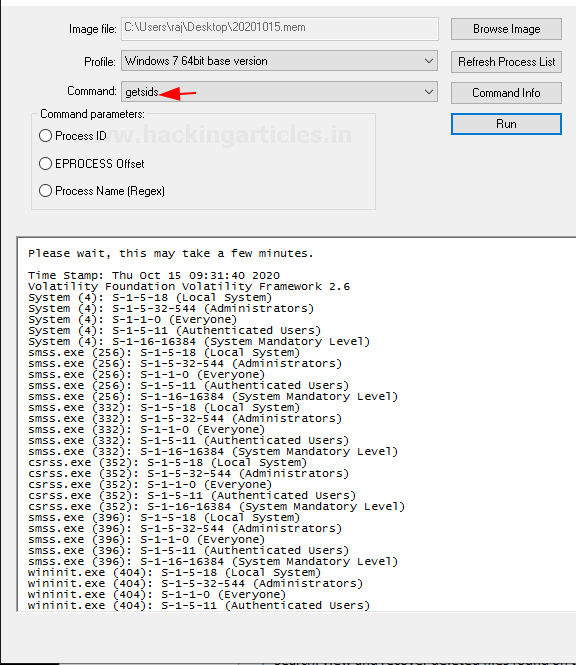
Getsids
This command can be used to view the Security Identifiers that are associated with a particular process. With the help of this command, you can identify if any malicious process has taken any privilege escalation.
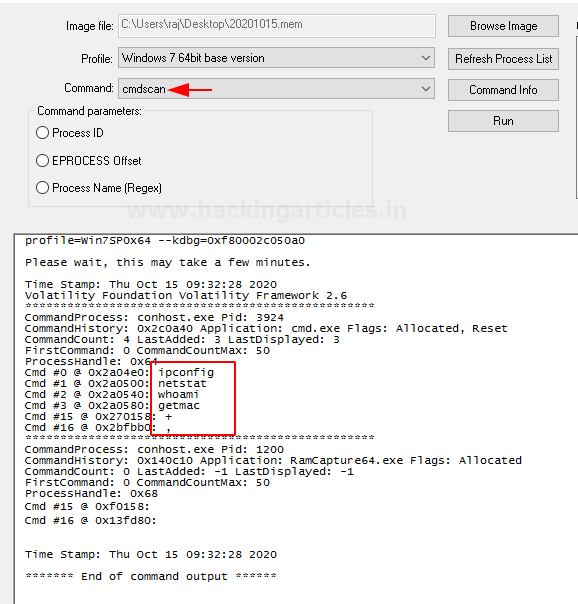
Cmdscan
This plugin helps in searching the memory dump for the command the user must have used the cmd.exe application. This command is highly used if the attacker’s command activity is to be traced.
Consoles
This command is similar to cmdscan and helps to find if the attacker had typed anything in cmd or had executed anything via the backdoor.

Privs
This command displays the privileges assigned to the processes that are enabled or not enabled by default.

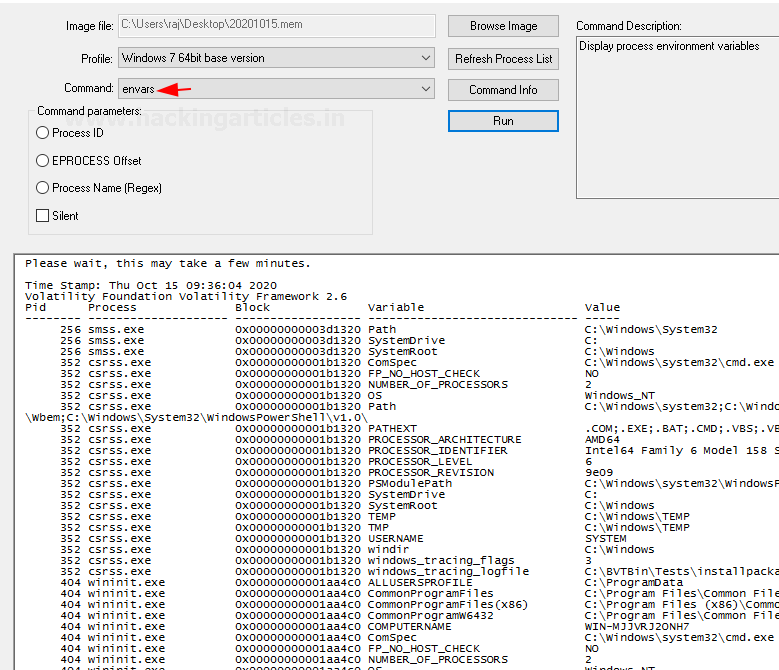
Envars
This command displays all the variables in the process, its environment along with its current directory.
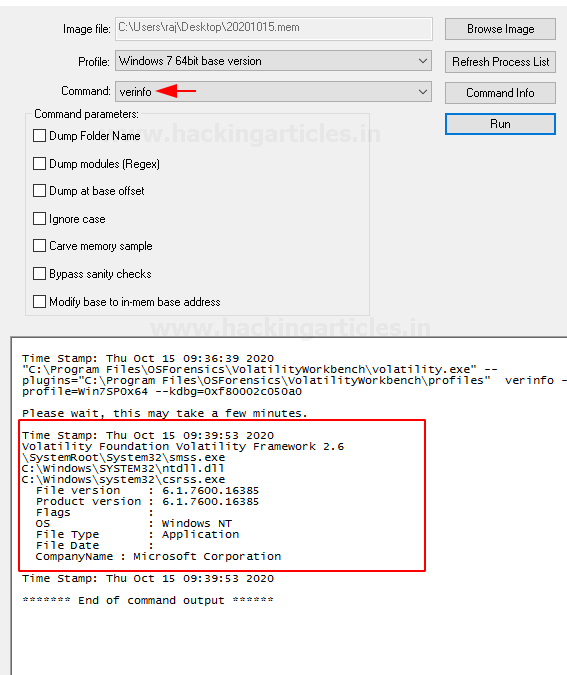
Verinfo
This command displays the version information that is present in the PE files. It helps identify any binaries and also correlates with other files.
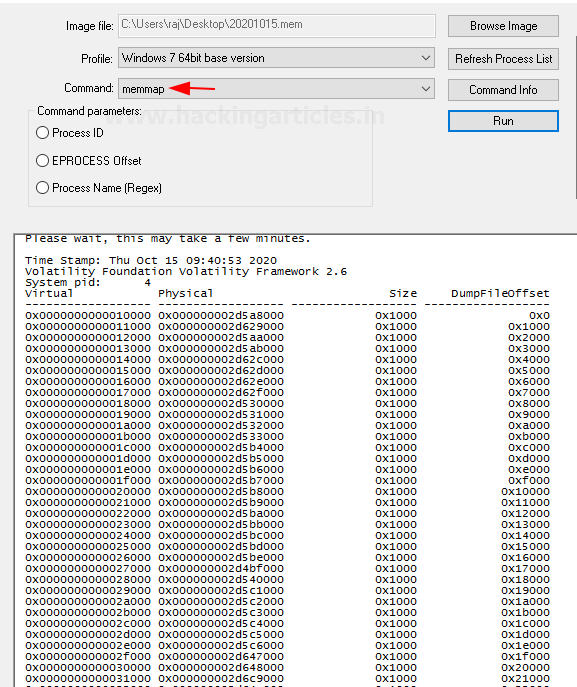
Memmap
This command shows the exact pages that are present on the page of a specific process. It also shows the virtual address of the page and the size of its page.
Vadinfo
This command usually displays information about a particular process’s VAD nodes. It displays the VAD Flags control flags, VAD tags.

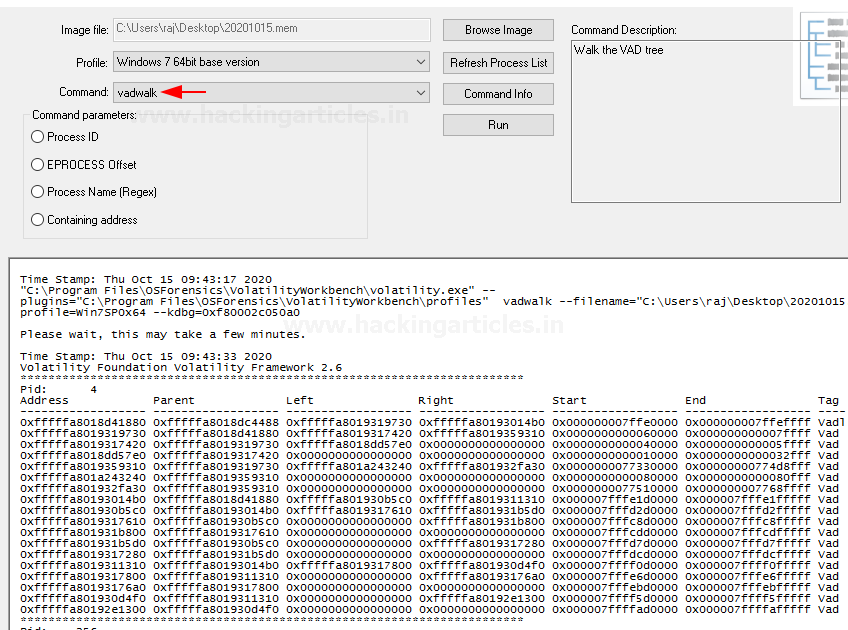
Vadwalk
It is a command that is used to display all the VAD nodes in a tabular form.
Vadtree
This process displays the VAD nodes in a tree form.

iehistory
This Plugin helps in recovering the fragments of the Internet explore history index.dat named cache files. It displays FTP and HTTP links that were accessed, links that were redirected, any deleted entries.

Modules
This command lists the kernel drivers that are present in the system.

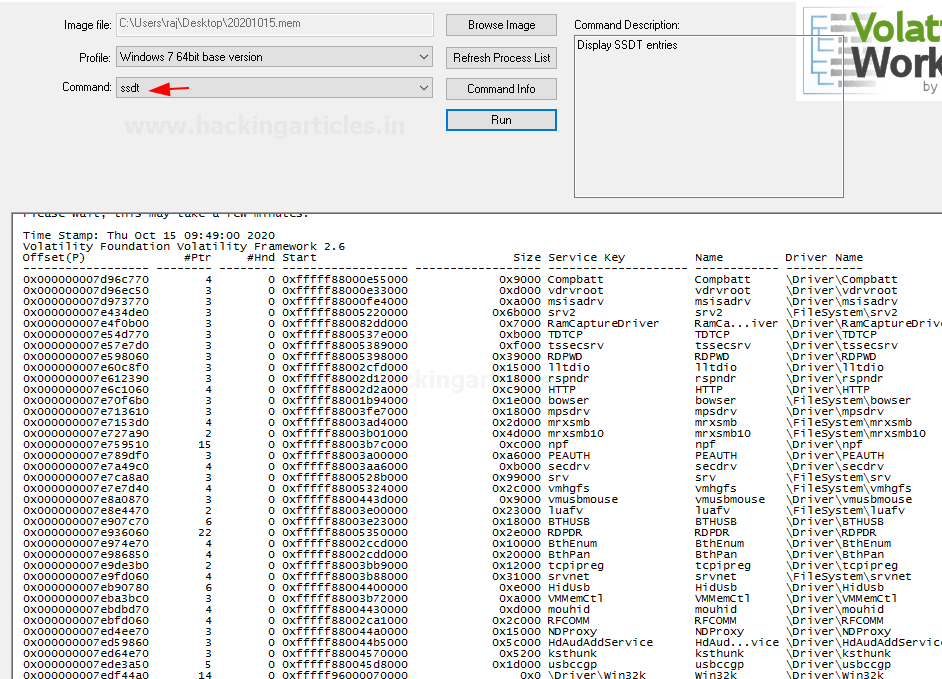
SSDT
This command lists the functions present in the original and GUI SSDTs. It displays the index, the name of the function, and the owner of the driver for each entry in the SSDT.
Driverscan
You can use this command to find the DRIVER_OBJECT present in the physical memory by making use of a pool tag scan.

File Scan
You can use this command to find the File_object present in the physical memory by making use of a pool tag scan. This command will help you find open files in the system dump even if rootkit hides them.

Mutant scan
This command is used to scan the physical memory of kmutant objects by making use of pool tag scanning.

Thrdscan
This command is used to find the ethread objects that are present in the physical memory with the help of a pool tag scan. It contains certain fields that can identify its parent processes which can help in finding hidden processes.

Netscan
This plugin helps in finding network-related artifacts present in the memory dump. It makes use of pool tag scanning. This plugin finds all the TCP endpoints, TCP listeners, UDP endpoints, and UDP listeners. It provides details about the local and remote IP and also about the local and remote port

Hivescan
This command is used to find the physical address of the registry hives that are present in the memory. It is there to support the hivelist.

Hivelist
This command can be used to locate the virtual addresses present in the registry hives in memory, and their entire paths to hive on the disk.

Printkey
This command is used to display the values, data, subkeys, and data types that are present in a specified registry.

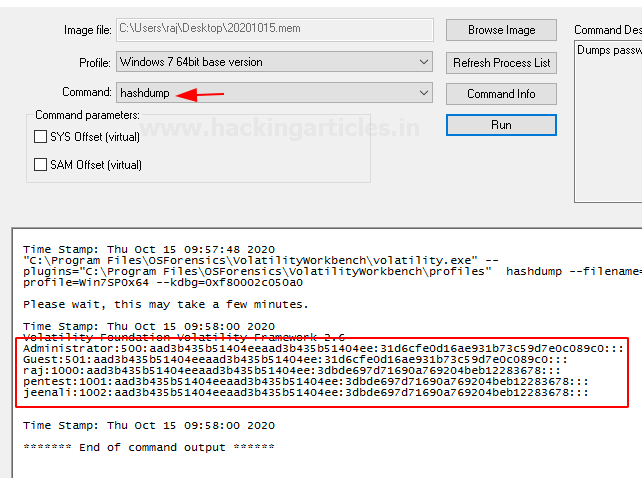
Hashdump
You can use this command to extract and decrypt cached domain credentials stored in the registry, which you can obtain from the memory dump. You can crack the hashes obtained from the memory dump using John the Ripper, Hashcat, etc.
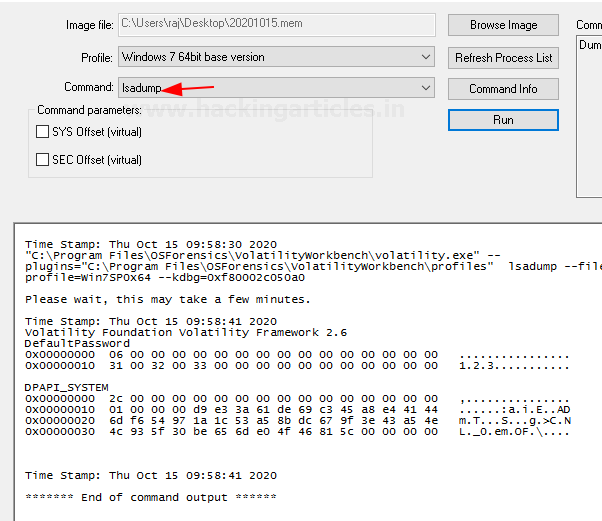
Lsadump
This command dumps LSA secrets from the registry in the memory dump. This plugin provides information like the default password, the RDP public key, etc.
Shellbags
This command usually parses and prints the shellbag information that the registry provides.

Getservicesids
This command does the work of calculating the SIDz for the services that are present on the machine. The name of the services has been taken from the registry.
 z
z
Dumpregistry
This plugin allows one to dump a registry hive into a disk location.

Mbrparser
This command scans and parses potential MBR from the memory dump. There are various ways to find MBR and the way of filtering it.

Mftparser
This command scans the MFT entries in the memory dump and prints out the information for certain types of file attributes.

To learn more about Cyber Forensics. Follow this Link
Author: Jeenali Kothari is a Digital Forensics enthusiast and enjoys technical content writing. You can reach her on Here
In the new workbench version many commands such as psxview or cmdscan are missing.
Also how to determine profile of the .mem file without imageinfo ? In the older version the workbench there are various categories in profille , how to determine the correct one for the .mem file?
You guys are amazing and Thank you for making such articles very easy to understand