Digital Forensics Investigation through OS Forensics (Part 2)
In Part 1 of this article, we have covered Creating case, File Search and Indexing. This article will cover some more features/ functionalities of OS Forensics.
For Part 1 if this article clicks here.
Recent Activity
Recent Activity feature allows an investigator to scan the evidence for recent activity, such as accessed websites, USB drives, wireless networks, recent downloads and many more.
To start with open OSForensics and select Recent Activity.
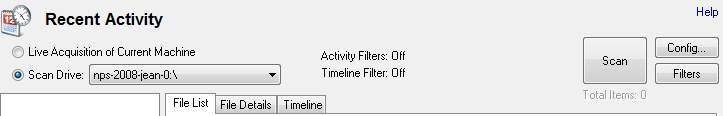
We have an option to capture the Recent Activities either through the live acquisition of current machines or by scanning drives/evidence.
To capture the live acquisition of the current machine select the first option and click on scan. If we have opted to investigate the case of another machine at the time of creating the case (shown in part 1 of this article), we may get a warning message as shown below, Click on yes to continue.

But we will be acquiring our evidence (.E01 image file).
Scanning will start and may take some time for this operation to complete.
Once the scanning is complete we will get a pop up with the summary of the scanned evidence.

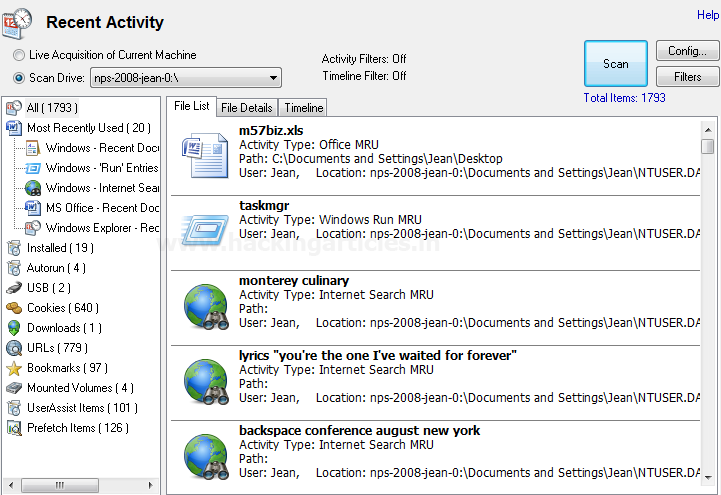
Click on the OK button and on the recent activity window we can find all the recent activity details with the heading on the left pane and details of related files on the right.
Exploring Scan Results and File Analysis
Below is the list view of the files
We can also view the file details by clicking on the File Details tab

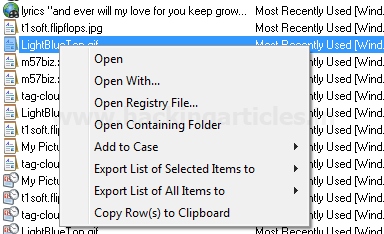
To further analyze any file, simply right-click on file for further file options.
Similarly, we can investigate the recent activity of any particular drive.
We can also change the configurations or apply/remove any filters as per the requirement but these changes are to be done before starting the scan.
To edit the configurations click on “Config” button located at the top right corner on recent activity window.
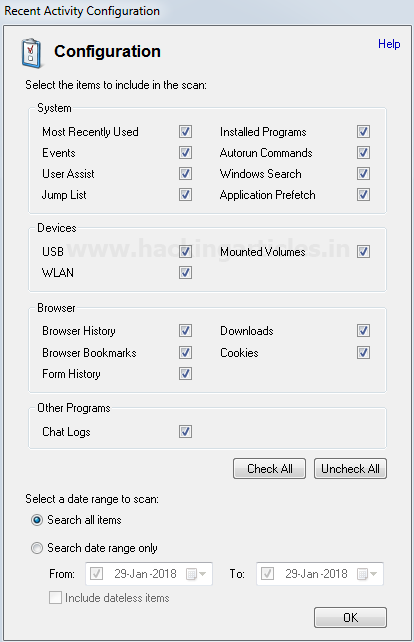
Check/Uncheck the options as required or if required change the date/date range for a particular time-based activity and click OK.
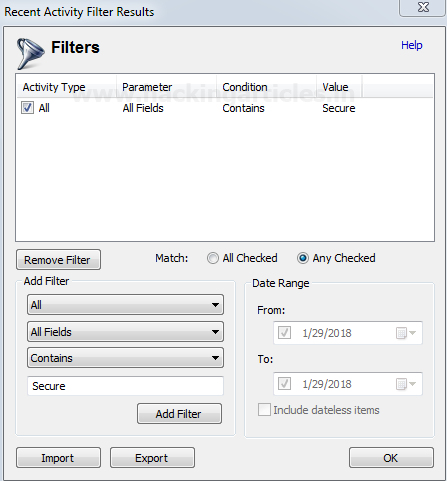
For managing the filters click on the “Filters” button located below the “Config” button

We can add a filter as required by selecting a value from the drop-down or fill the details as required.

In the below image we have applied a filter and set its parameters as per requirement.

Click on Add Filter button and then OK, the filter will get added.
This ends the Recent Activity feature.
Deleted File Search
Deleted files recovery is one of the prime requirements for digital forensics. OSF offers a very simple and efficient deleted file recovery/search.
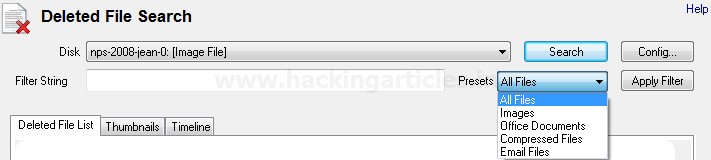
To search the deleted files click on “Deleted files Search” and select the drive we want to search on from the drop-down. We can select the complete Physical drive/Hard Disk (PhysicalDrive0), Acquired Evidence or any Logical drive(C/D/E), for which we want to recover the data.

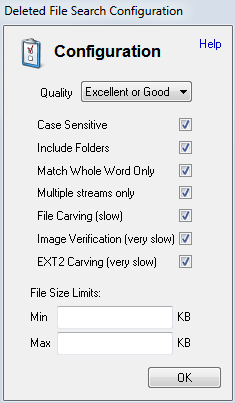
Click on the “Config” button and check/uncheck the options as required. Select the Quality from the drop-down (Please note better the quality more time it will take to process), for better result check the file carving option. We can also limit the file size we want to search for (this will omit the files that are not in the range to refine the search), Click Ok.
On preset drop-down select the file type we want to recover/search. Select all files if we need to have multiple file types as output.
Once all the settings are done, click on Search. Depending on the volume of data and configurations we opted for it may take some time for the process to complete.

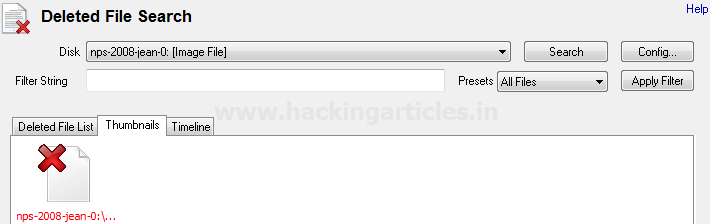
We can also see the thumbnail view of the files for faster analysis.
To save /recover the file select the files we want to recover and right-click for options and save the files.

This concludes the Deleted file search.
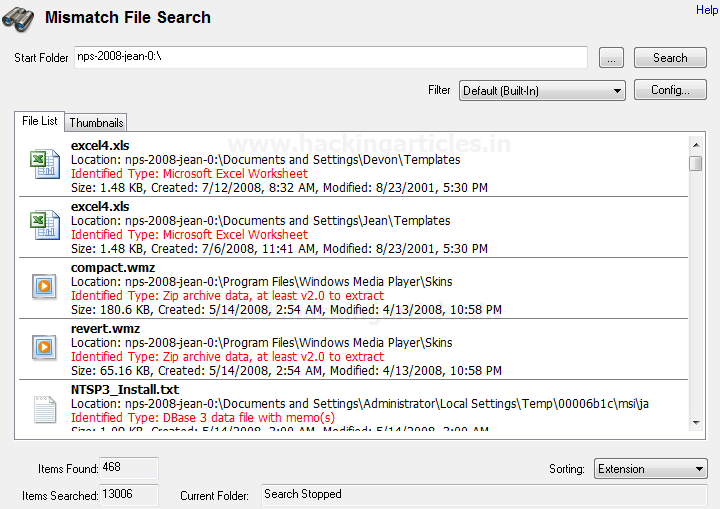
Mismatch File Search
This feature enables us to identify the files whose extensions don’t match their data. Through this, we can capture some relevant evidence that could be in form of an image, document or pdf but pretending to be of some other extension. For example, a word file can be mismatched with a jpeg file (such a data could be also called “Dark Data”).
To start with click on Mismatch File Search, select the drive/directory along with the filter from the drop-down or create a filter as required, if we are not sure about the filter settings, we can go with “All (Built In)” filter and click search.
This will show the result in the file list. We can also see the thumbnail view of the files.
Memory Viewer
Memory Viewer feature shows active memory of the system on which OSF is working on. It can’t be used to show the memory of acquired image or drive of another computer (we will illustrate this feature on our running machine and not on our evidence file). We can dump the live memory /RAM for further investigation.
To start with open OSF and click on Memory Viewer. We can see the list of all the processes currently running along with their Process ID (PID). Click on any process and we can see its details under process Info. Click on refresh to refresh the process list.

Then, Click on the select window the cursor icon will change from pointer to a circle, click anywhere on-screen or on any other running application and we can see the process details of the process we have clicked on. For instance, in the below image we have clicked on an open word file and the process corresponding to that word file will get displayed.

Dumping Physical Memory and Crash Dumps
Click on dump Physical Memory, this will dump the physical memory/ RAM in a .bin file and can save it anywhere. In below image, we are saving the file with name Memory Dump.bin in a folder named Physical Memory Dump on Desktop

As we click on save pop up will appear till the Memory is being dumped.

Once completed, we will get a success Message.

We can also save a crash dump, just browse to a directory and save the file. The extension of the crash dump file is .dmp. In the below image, we are saving a crash dump file with a name CrashDump.dmp. We will get the following message when the dump is in progress

Once the dump is completed we will get a success message.
This concludes the Memory Viewer
Prefetch Viewer
The prefetch viewer displays the .exe files that we have last executed on the system. To start with open OS Forensic and click on prefetch viewer.

We can browse the drive from the drop down to check the .exe file that has executed on a particular drive. We can click on any particular drive and can see the details of the exe along with mapped files under the mapped file tab.

Also, we can view the directories, mapped with the .exe file under Mapped Directory Tab.

This concludes the Prefetch Viewer.
To learn more about Cyber Forensics. Follow this Link
Author: Ankit Gupta, the author, and co-founder of this website, an ethical hacker, forensics investigator, penetration testing researcher and telecom expert. He has found his deepest passion to be around the world of telecom, cyber security and digital forensics. Contact Here
Hello. You got a nice article here and very much updated.
Care to share the image of the system? so we (newbies) can also try your ways. thanks a bunch, mate
Thanks…To try with you can create an image of your system or any drive. To create an image of your drive you can go through this link. http://www.hackingarticles.in/forensic-imaging-encase/
please add how to bypass hsts
with new method