Comprehensive Guide to tcpdump (Part 1)
In this article, we are going to learn about tcpdump. It is a powerful command-line tool for network packet analysis. Tcpdump helps us troubleshoot the network issues as well as help us analyze the working of some security tools.
Table of Content
- Introduction
- Available Options
- List of interfaces
- Default working
- Capturing traffic of a particular interface
- Packet count
- Verbose mode
- Printing each packet in ASCII
- Don’t convert address
- Port filter
- Host filter
- The header of each packet
- TCP sequence number
- Packet filter
- Packet Direction
- Live number count
- Read and Write in a file
- Snapshot length
- Dump mode
Introduction
Tcpdump was originally developed in 1988 by Van Jacobson, Sally Floyd, Vern Paxson, and Steven McCanne. They worked at the Lawrence Berkeley Laboratory Network Research Group.
It allows its users to display the TCP/IP and other packets being received and transmitted over the network. Tcpdump works on most of the Linux based operating systems. It uses the libpcap library to capture packets, which is a C/C++ based library. Tcpdump has a windows equivalent as well. It is named windump. It uses a winpcap for its library.
Available Options
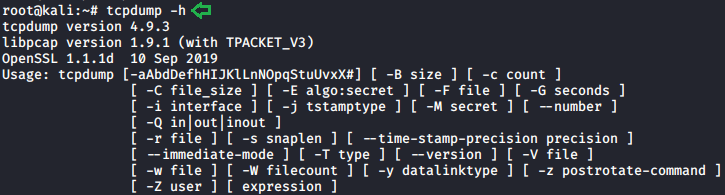
We can use the following parameter to print the tcpdump and libpcap version strings. Also, we can print a usage message that shows all the available options.
tcpdump -h
tcpdump --help
List of interfaces
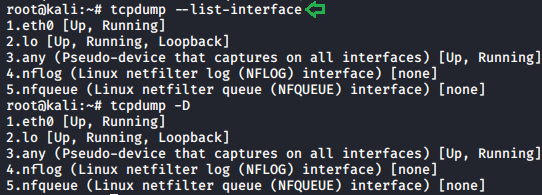
An interface is the point of interconnection between a computer and a network. We can use the following parameter to print the list of the network interfaces available on the system. It can also detect interfaces on which tcpdump can capture packets. For each network interface, a number is assigned. This number can be used with the ‘-i’ parameter to capture packets on that particular interface.
There might be a scenario where the machine that we are working on, is unable to list the network interfaces it is running. This can be a compatibility issue or something else hindering the execution of some specific commands (ifconfig -a).
tcpdump –list-interface
tcpdump -D
Default Capture
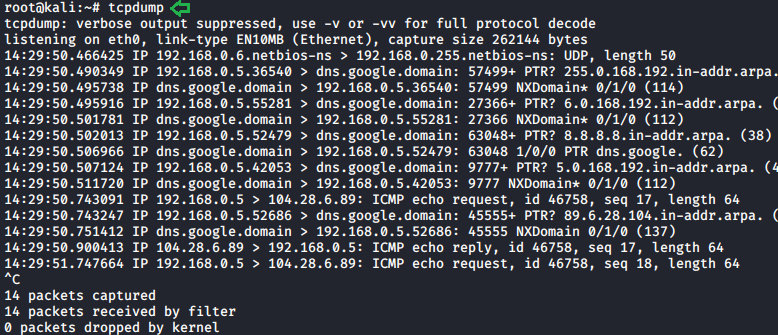
Before moving onto to advanced options and parameters of this network traffic capture tool let’s first do a capture with the default configurations.
tcpdump
Capturing traffic of a particular interface
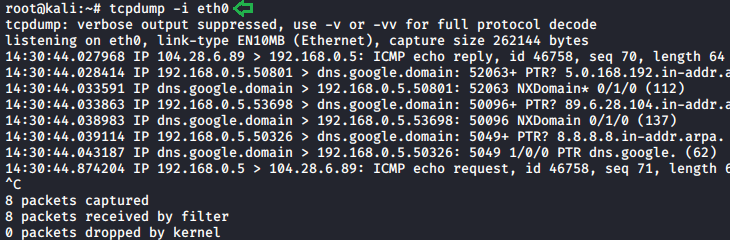
We will capture traffic using the ethernet network known as “eth0.” A category 5 cable usually connects this type of interface to the network.
To select this interface we need to use -i parameter.
tcpdump -i eth0
Packet count
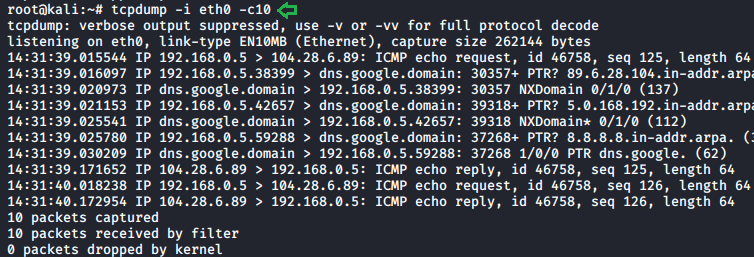
Tcpdump has some amazing features which we can use to make our traffic analysis more efficient. We can access some of these features using various parameters. We use the -c parameter, it will help us to capture the exact amount of data that we need and display those. It refines the amount of data we captured.
tcpdump -i eth0 -c10
Verbose mode
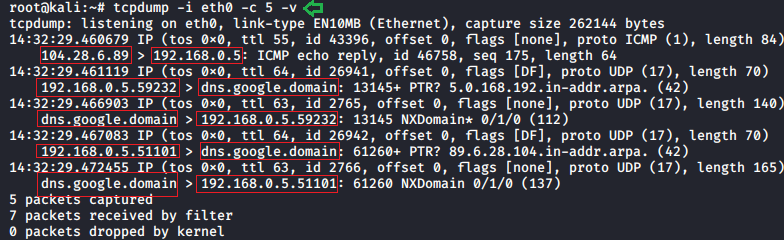
The verbose mode provides information regarding the traffic scan. For example, time to live(TTL), identification of data, total length and available options in IP packets. It enables additional packet integrity checks such as verifying the IP and ICMP headers.
To get extra information from our scan we need to use -v parameter.
tcpdump -i eth0 -c 5 -v
Printing each packet in ASCII
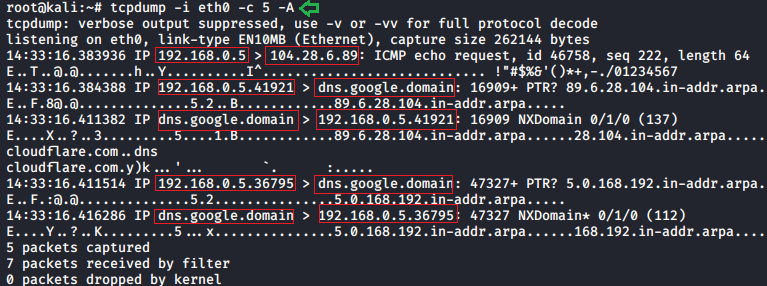
ASCII is the abbreviation of the American Standard Code for Information Interchange. It is a character encoding standard for electronic communication. ASCII codes represent the text in computers and other devices. Most of the modern character encoding techniques were based on the ASCII codes. To print each packet in ASCII code we need to use -A parameter.
tcpdump -i eth0 -c 5 -A
Don’t convert address
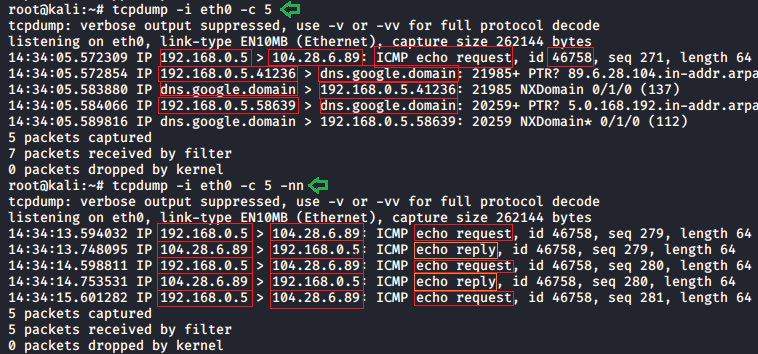
With the help of the tcpdump -nn parameter, we can see the actual background address without any filters. This feature helps us to understand the data traffic better without any filters.
tcpdump -i eth0 -c 5
tcpdump -i eth0 -c 5 -nn
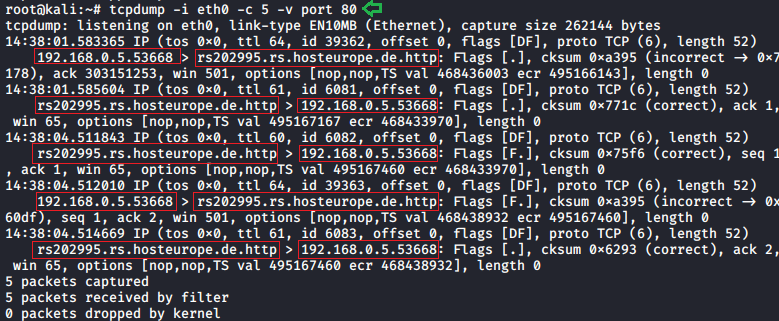
Port filter
Port filter helps us to analyze the data traffic of a particular port. It helps us to monitor the destination ports of the TCP/UDP or other port-based network protocols.
tcpdump -i eth0 -c 5 -v port 80
Host filter
This filter helps us to analyze the data traffic of a particular host. It also allows us to stick to a particular host through which further makes our analyzing better. Multiple parameters can also be applied, such as -v, -c, -A,-n, to get extra information about that host.
tcpdump host 104.28.6.89 -c10 -A -n

The header of each packet
The header contains all the instructions given to the individual packet about the data carried by them. These instructions can be packet length, advertisement, synchronization, ASCII code, hex values, etc. We can use -X parameter to see this information on our data packets.
tcpdump -i eth0 -c 3 -X

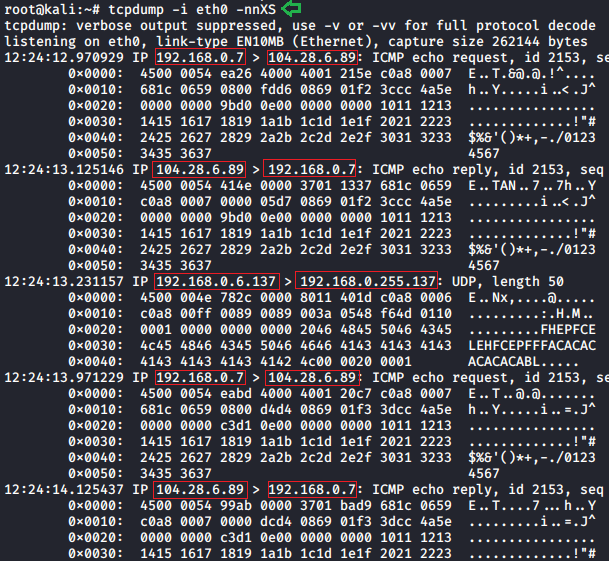
TCP sequence number
All bytes in TCP connections has there sequence number which is a randomly chosen initial sequence number (ISN). SYN packets have one sequence number, so data will begin at ISN+1. The sequence number is the byte number of data in the TCP packet that is sent forward. -S parameter is used to see these data segments of captured packets.
tcpdump -i eth0 -nnXS
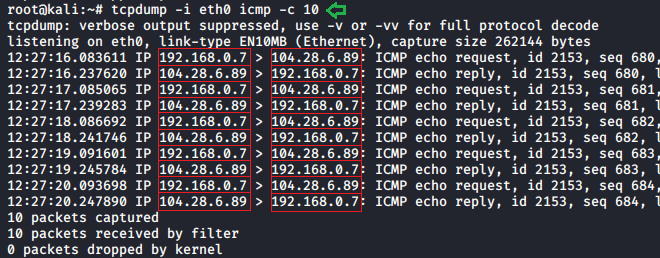
Packet filter
Another feature that is provided by tcpdump is packet filtering. This helps us to see the packet results on a particular data packet in our scan. If we want to apply this filter in our scan we just need to add the desired packet in our scan.
tcpdump -i eth0 icmp -c 10
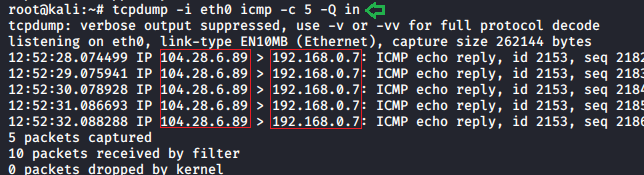
Packet directions
To the direction of data flow in our traffic, we can use the following parameter :
tcpdump -i eth0 icmp -c 5 -Q in
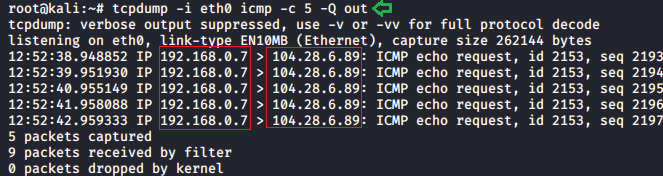
To see all the requests which we are sending to the server following (- Q out) parameter can be used:
tcpdump -i eth0 icmp -c 5 -Q out
Live number count
We can apply the live number count feature to see how many packets the system scanned or captured during the data traffic scans. –The number parameter counts the number of packets that the system captures in a live scan. We also compared packet count to live number count to see its accuracy.
Read and write in a file
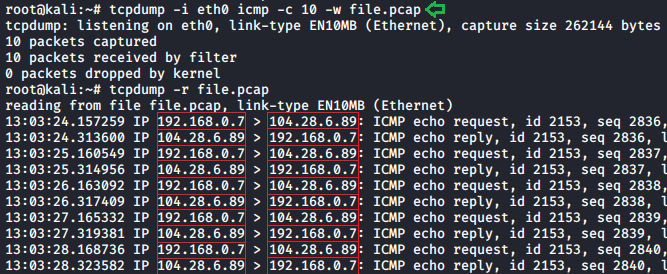
In TCPDump, we can write and read into a.pcap extension file. Specifically, the write option(-w) allows us to write raw data packets that we receive as output to a standard.pcap file. On the other hand, the read option(-r) helps us read that file. To illustrate, follow the steps below to write the output in .pcap format:
tcpdump -i eth0 icmp -c 10 -w file.pcap
To read this .pcap file we follow:
tcpdump -r file.pcap
Snapshot length
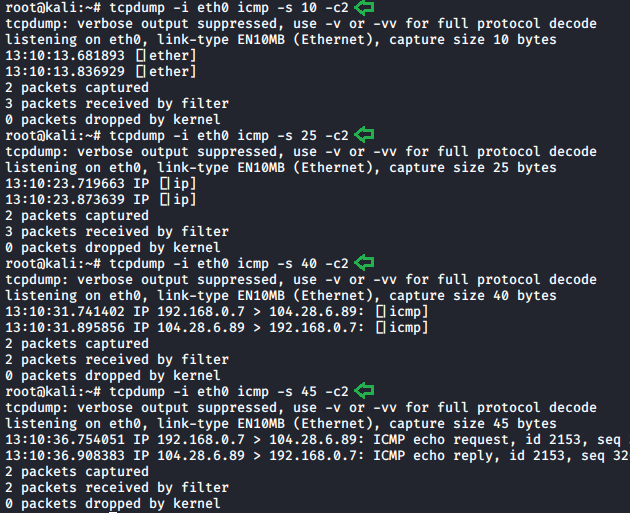
Snapshot length/snaplen is referred to as the bytes of data from each packet. It is by default set on the 262144 bytes. With tcpdump, we can adjust this limit to our requirement to better understand it in each snap length. -s parameter helps us to do it just apply -s parameter along with the length of bytes.
tcpdump -i eth0 icmp -s10 -c2
tcpdump -i eth0 icmp -s25 -c2
tcpdump -i eth0 icmp -s40 -c2
tcpdump -i eth0 icmp -s45 -c2
Dump mode
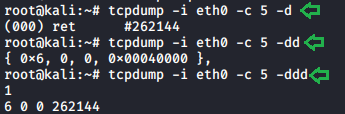
Dump mode has multiple parameters like -d, -dd, -ddd. To begin with, the -d parameter dumps the compiled matching code into a readable output. Furthermore, the -dd parameter dumps the code as a C program fragment. Finally, the -ddd parameter dumps the code as a decimal number with a count. To see these results in our scan, we need to follow the steps below:
tcpdump -i eth0 -c 5 -d
tcpdump -i eth0 -c 5 -dd
tcpdump -i eth0 -c 5 -ddd
This is our first article in the series of a comprehensive guide to tcpdump. Which is based on some basic commands of tcpdump. Stay tuned for more advance option in this amazing tool.
To learn more about Penteration Testing. Follow this Link.
Author: Shubham Sharma is a Pentester and a Cybersecurity Researcher, contact LinkedIn and Twitter.
Your excellent materials have been a great help to me. I offer my deep gratitude. Gratias multum.
Thanks