Burp Suite for Pentester: Web Scanner & Crawler
You might be using a number of different tools in order to test a web-application, majorly to detect the hidden web-pages and directories or to get a rough idea about where the low-hanging fruits or the major vulnerabilities are.
So today, in this article, we’ll discuss how you can identify hidden web pages or determine the existing vulnerabilities in a web application. To do this, we will use one of the best intercepting tools – “Burp Suite”.
Table of Content
- The Burp’s Crawler
- What is Crawler?
- Crawl with default configurations
- Customizing the Crawler
- Vulnerability Scanning over Burp Suite
- Auditing with default configurations.
- Defining Audit options.
- Crawling & Scanning with an advanced scenario
- Deleting the defined Tasks
The Burp’s Crawler
What is Crawler?
The term web-crawler or web-spider is the most common and is been used a number of times while testing a web-application. So, what this crawler is ??
Carrying with its name we can depict that a crawler surveys a specific region slowly and deeply and then drops down the output with a defined format.
So is the Burp’s Crawler the same thing ??
According to port swigger “The crawl phase involves navigating around the application, following links, submitting forms, and logging in, to catalog the content of the application and the navigational paths within it.”
In simpler terms, we can say that the Burp crawler programmatically navigates through the entire web application. It follows redirecting URLs, logs into login portals, and then organizes everything in a tree-like structure within the Site Map view in the Target tab.
However, this crawler functions similarly to tools like “Dirb” or “DirBuster”—web content scanners that brute-force the web server to identify and reveal the web application’s visited, non-visited, and hidden URLs.
Earlier over in the previous versions of burpsuite say “1.7”, we got this crawler termed as “Spider”. So why did this happen? What new features did the burp crawler carry that made the spider vanish?
Let’s dig it out !!
Crawl with default configurations !!
If you’re familiar with the spider feature, you might know that the spider holds a specific tab within Burp Suite’s panel. However, with recent enhancements, Burp’s crawler is now predefined within the dashboard section. This improvement allows us to monitor and control Burp’s automated activities in one central place.
So, in order to initiate with the crawler, let’s turn ON our Burp Suite and redirect to the Dashboard section there.

Details on Dashboard Subsection
As soon as we land at the dashboard panel, we can see the number of subsections specified. Let’s explore them in details :
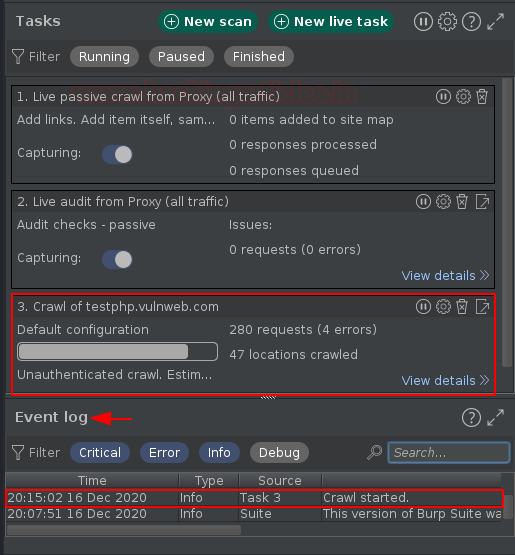
Tasks – The “Tasks” section carries the summary of all the running crawls and scans, whether they are user-defined or the automated ones. Here, we can pause and resume the individual tasks, or all tasks together, and even we can view the detailed versions of a specific crawl or audit too.
Event log – The Event log feature generates all the events that Burp Suite tracks, such as when the proxy starts up, it generates an event for it, or when a specific section is not working properly, it generates an event log for that.
Issue Activity – This section drops out the common vulnerabilities within the application that the burpsuite scans up and further we can segregate them all by applying the defined filters according to their severity and destructiveness.
Advisory – This is one of the most important section of the burp’s dashboard as it demonstrates the selected vulnerability in the expanded form such by defining the payload with a Request & Response, mentioning the cause of its existence, defining the mitigation steps and dropping the reference and the CVSS Scores for our review.
Thereby, to dig web-application we need to hit the “New Scan” button placed at the top of the Tasks section.

As soon as we do so, we’ll be redirected to a new pop-up window stating “New Scan”.
New Scan Pop UP!!
There we’ll be welcomed with two options –
- Crawl & Audit
- Crawl
However, for this section, we’ll make it to “Crawl” only. And the other one, we’ll discuss later in this article.
As we’re heading with the default configurations thus we’ll simply type the testing URL i.e. “http://testphp.vulnweb.com/” and will hit the “OK” button.

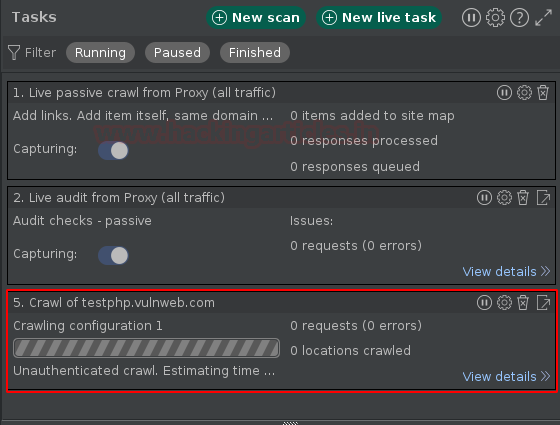
As we do so, the window will disappear, and we’ll see our new task aligned in the dashboard as “Crawl of test.vulnweb.com”, and in the event log, we can see that we received the event “Crawl started”.
Within a few minutes, the crawling task will get finished up and we’ll get the notification there. But where’s the result ??
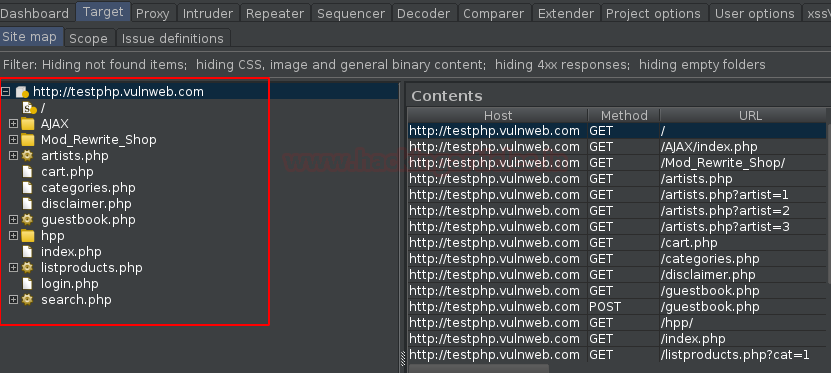
As defined earlier, the crawler dumps the result in a tree-like format in the Site Map view in the Target tab, let’s move there.

Great !! We got what we desire for. Over in the right panel we’re having about almost every URL of the webpage, along with that, it carries up the HTTP methods and a parameter section that defines which URL requires a Params value within it.
A number of major vulnerabilities exist due to the unsanitized input fields thereby with this dumped data we can simply segregate the URL’s that contains the Input values which thus can be further tested on. And for this simply double click the “Params” field.

However, if we want to check the pages or a specific directory, we can simply navigate the left side and select our desired option there.

Customizing the Crawler
What, if some specific webpages are out of Scope ?? Or does the website need some specific credentials to surf the restricted web pages?
Therefore, in such cases, we need to configure our crawler such that it can work as we want it to. So, to do this, let’s get back to the dashboard and select the “New Scan” option again. But for this time, we won’t hit “OK” after setting the URL.
Configuring Out of Scope URL’s
Below in the protocol setting, there is an option for the Detailed Scope Configuration, where we’ll simply navigate to the “Excluded URL prefixes” and will enter the Out of Scope URL, i.e.
http://testphp.vulnweb.com/signup.php

For further customization, we’ll thus move to the Scan Configuration option. And there we’ll hit the “New ” button to set up a new crawler.
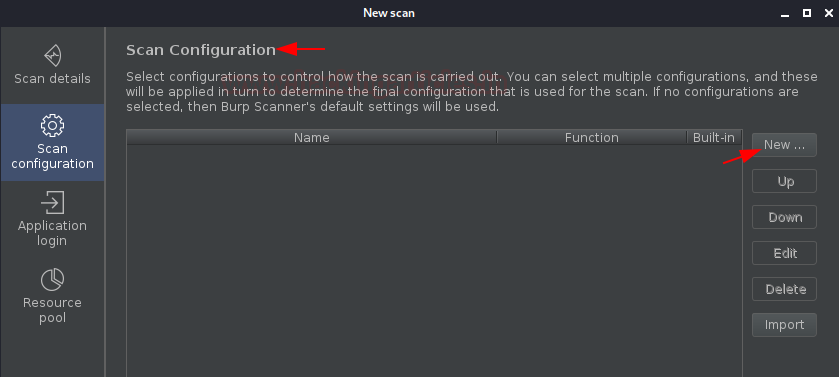
As soon as we do so, we’ll thus get another window open with the configuration options. Let’s keep the configuration name as the default, however, you can change if you wish so.
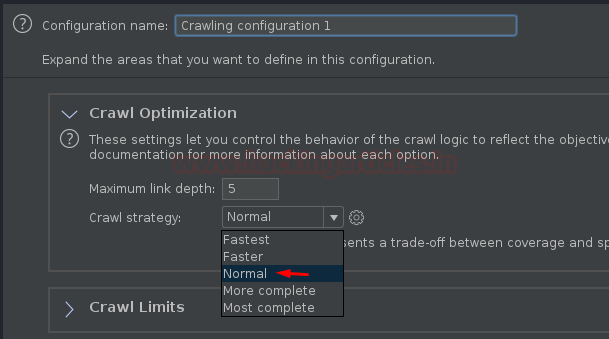
Further, the Crawl optimization option segregates within the “Fastest to the Deepest”, thereby we’ll thus change it according to our requirement.
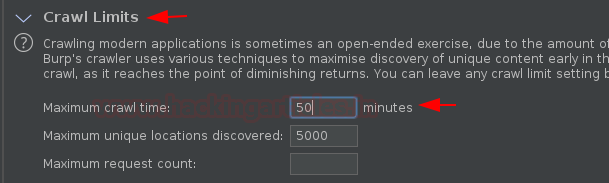
Setting the Crawl Limit and Credentials
Crawl Limit is considered to be an important factor as it determines the time required and the depth to crawl an application. Thereby, we’ll set the maximum crawl limit to 50 minutes and the Maximum unique locations discovered to 5000.
There are applications that carry user registration or login portals, thus checking both options will guide the burp’s crawler to self-register with some random values if it encounters a signup portal and even use wrong credentials at the login portals such in order to determine the website’s behaviour.

Now with all these configurations as soon as we hit the “Save” button we thus get our crawler listed at the New scan dashboard.

Handling Restricted Pages and Resource Pool
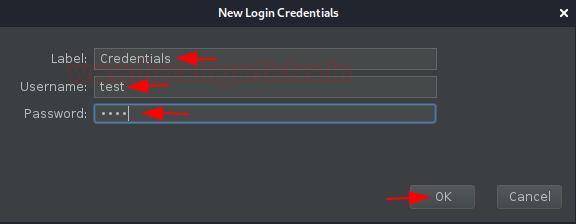
What, if the crawler encounters with the restricted pages? Or an admin portal? Thereby, for such situations, let’s feed up some default credentials so that the crawler can use them !!
Navigate to the “Application login” section and click on “New”.

Over in the pop-up box, enter the desired credentials & hit the “OK” button.
Along with all these things, we’re having one more option within the “New Scan dashboard”, i.e. “Resource Pool”.
A section defines the resource pool for the concurrent requests, or in simpler terms, we can say how many requests the crawler will send to the application in one go and what the time gap between the two requests will be.
Therefore, if you’re testing a fragile application that could go down with an excessive number of requests, then you can configure it accordingly, but as we’re testing the demo application thereby we’ll set them to default.

Now as we hit the “OK” button, we will start our crawler, which can thus be monitored at the dashboard.
Now, let’s wait for it to get END !! As we navigate to the Target tab, we’ll thus list our output, and there we can notice that the system does not mention the signup page, which indicates that our configuration worked properly.
Vulnerability Scanning Over Burpsuite
Rather being an incepting tool, burpsuite acts as a vulnerability scanner too. Thereby, it scans the applications with a name as “Audit”. There are a number of vulnerability scanners over the web and burpsuite is one of them, as it is designed to be used by the security testers, and to fit in closely with the existing techniques and methodologies for performing manual and semi-automated penetration tests of web applications.
So let’s dig the “testphp.vulnweb” vulnerable application and check out what major vulnerabilities it carries within.
Auditing with the default configuration
As we’ve already crawled the application thus it would be simpler to audit it, however, to launch a scanner all we need is a URL, whether we get it by incepting the request, or through the target tab.
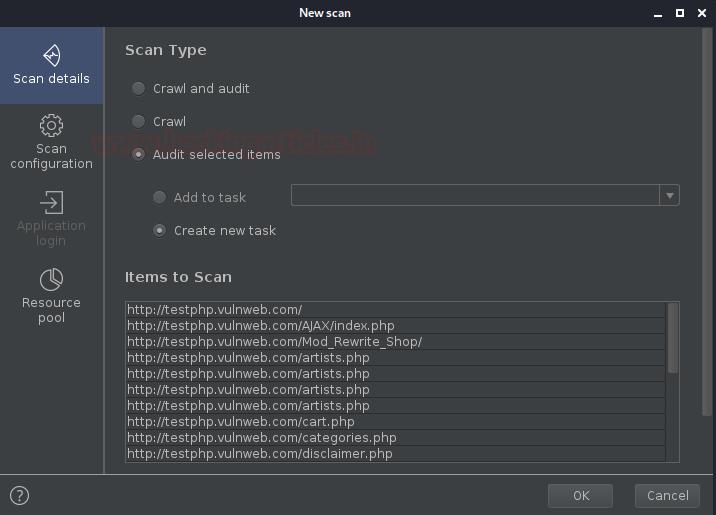
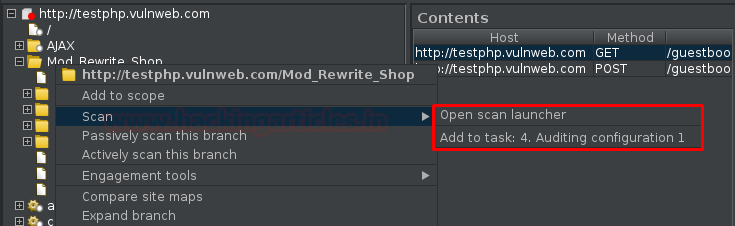
From the screenshot, you can perceive that we’ve sent the base URL by doing a right-click and opting the “Scan”.

Launching the Audit Scan
As soon as we do so, we’ll thus be redirected back to the New Scan’s Dashboard. But wait !! This time we’re having one more option i.e. “Audit Selected items”, as soon as we select it we’ll thus get all the URL’s within the Item to Scan box (This happens because we’ve opted the base request).
As we’re dealing with the default auditing, we’ll thus simply hit the “OK” button there.

And now I guess you know where we need to go. Yes !! The Dashboard tab.
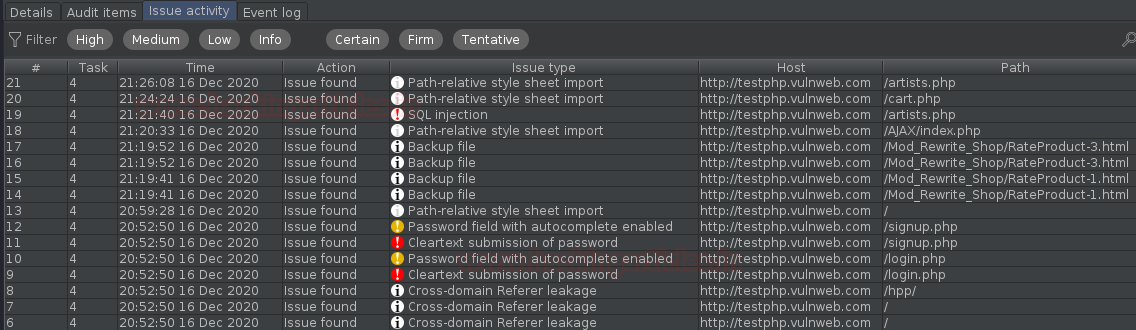
This time not only the Tasks section and the Event log is changed but we can see the variations in the Issue activity and the advisory sections too.
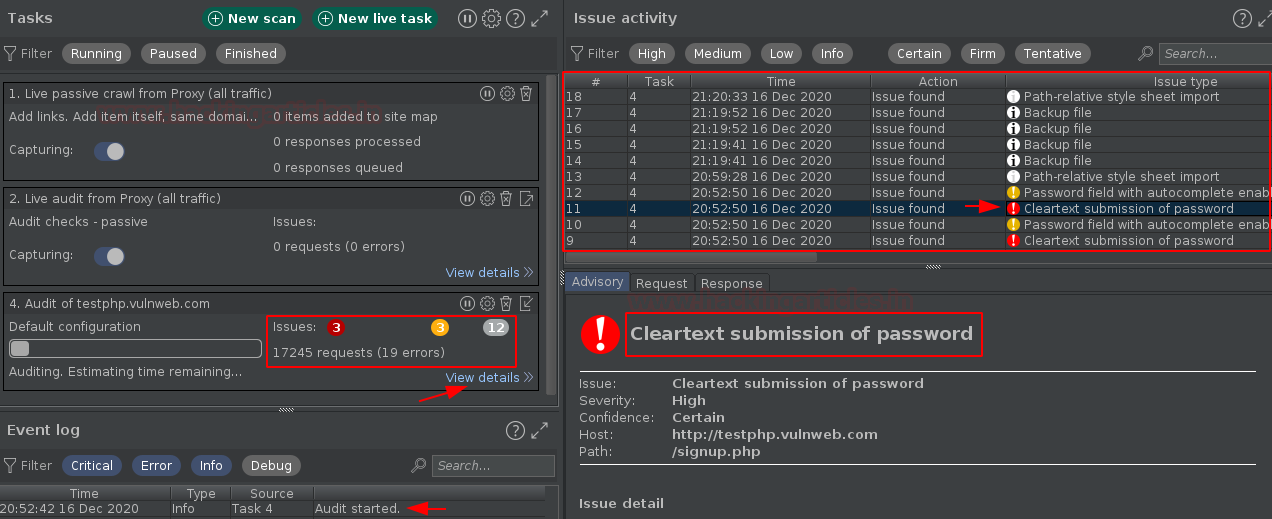
From the above image, we can see that within a few minutes, our scanner has sent about 17000 requests to the web application and even dumped several vulnerabilities according to their severity level.
Reviewing the Audit Results
What if we want to see the detailed version ??
To do so, simply click on the View Details section placed at the bottom of the defined task, and you will be redirected to a new window with all the refined details within it.

Cool!! Let’s check the Audited Items.
As we click the Audit Items tab, we’ll land on the detailed version of the audited sections, where we’ll see the statuses, Active & Passive phases, Requests per URLs, and many more.
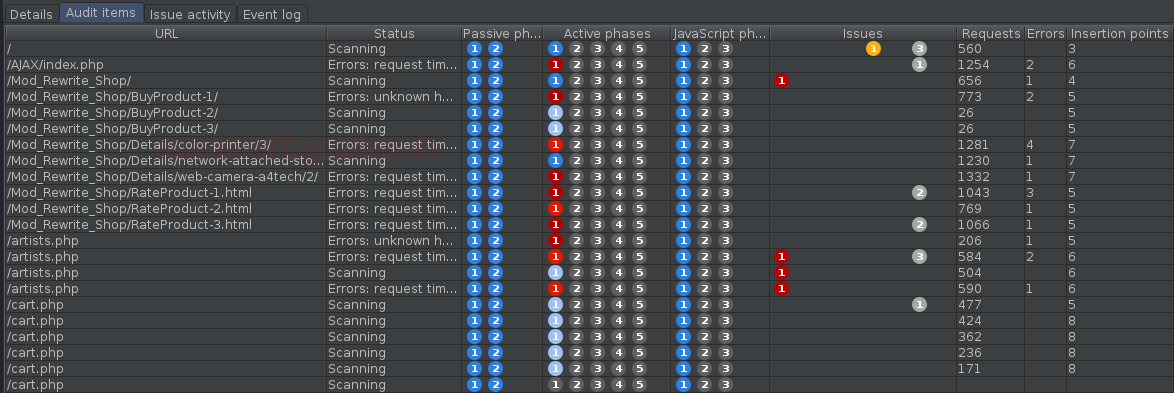
Further, we can even check the in-depth issues that we found in the web application.
Although we can even filter them according to their defined severity levels.
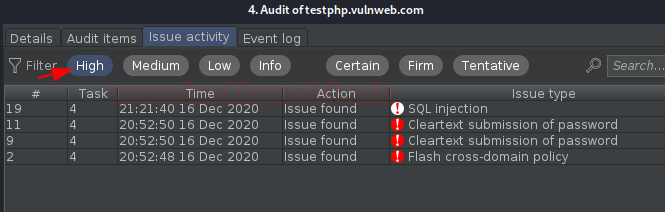
Inspecting the Vulnerabilities
Not only these things, over in the target tab, we find something waiting for us, i.e. the Issues and the Advisory also mention there, but if we look at the defined tree at the left panel, we see some colourful dots, majorly red and grey, indicating that these URLs have high and informative existing vulnerabilities respectively.

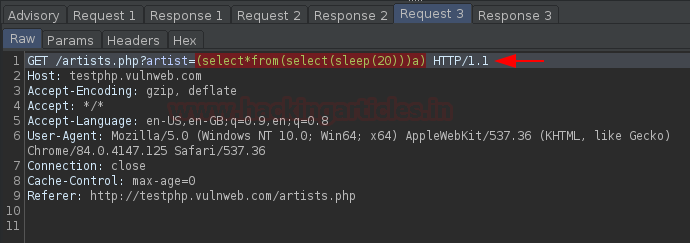
However, from the below image, with the Advisory option of SQL Injection, there is a specific panel for Request & Response, let’s check them and determine how the scanner confirms that there is an SQL Injection existing.

As we navigate to the 3rd Request, we got an SQL time-based query injected in the “artist=” field.
And as we shared this request with the browser, we got a delay of about 20 seconds, which confirms that the vulnerabilities dumped with the scanner are triggerable.
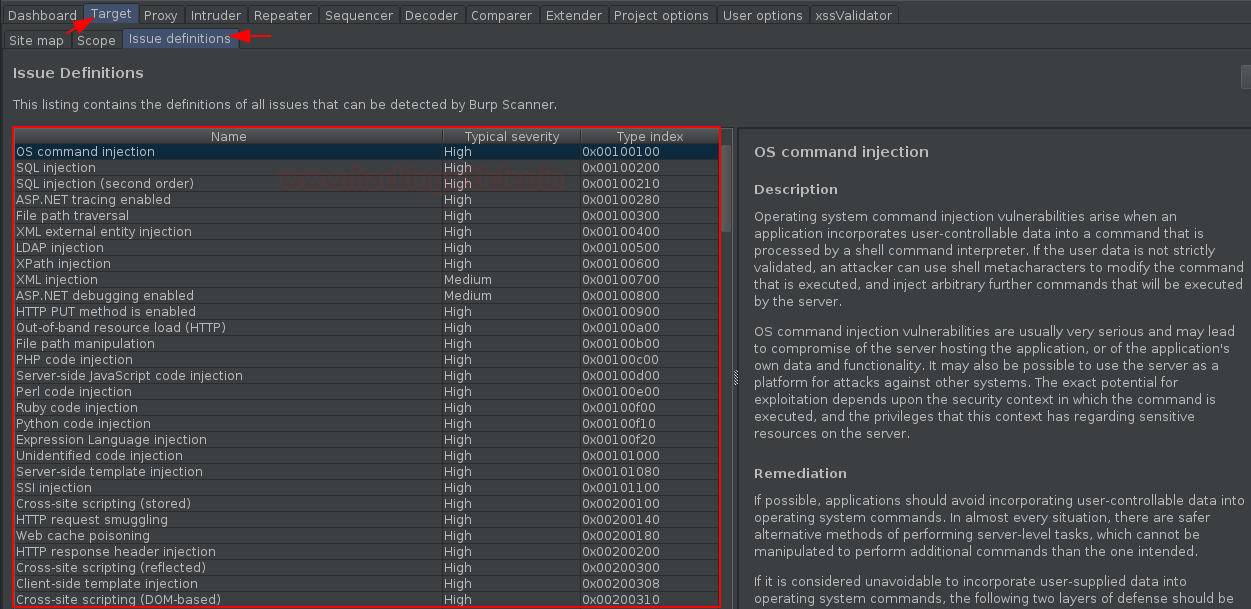
You might be wondering Okay, I got the vulnerability, but I’m not aware of it – what more could I get with or how could I chain it to make a crucial hit.
Therefore, in order to solve this issue, we have an Issue definition section, where we can simply go through the defined or captured vulnerability.
Defining Audit Configurations
Similar to the Crawling option, we can simply configure this Audit too, by getting back to the “New Scan” dashboard with a right-click on the defined URL & hitting Scan.
Here, in the above image, if we scroll down, we’ll thus get the same option to set the Out Of Scope URL as was in the Crawl section.
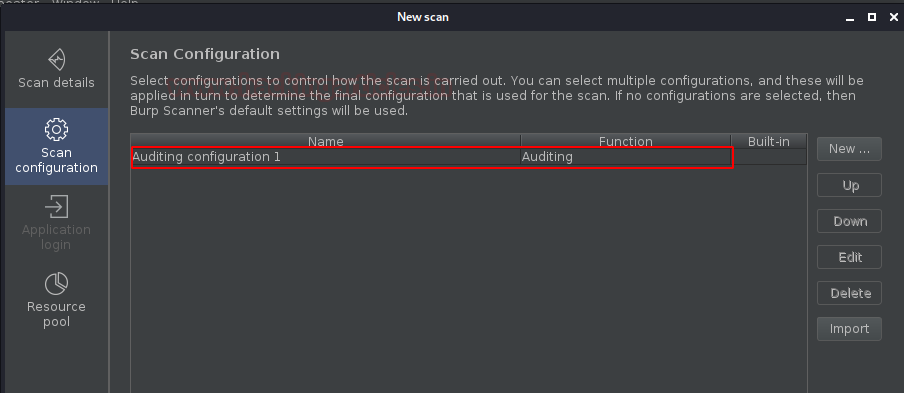
Now, moving further with the scan configurations, hit the “New” button as we did earlier.

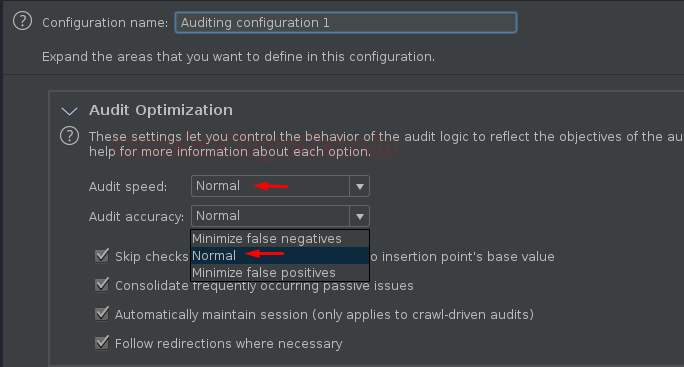
Setting the configuration name to default and manipulating the audit accuracy to normal, you can define it according to your need.
Choosing the Scan Type
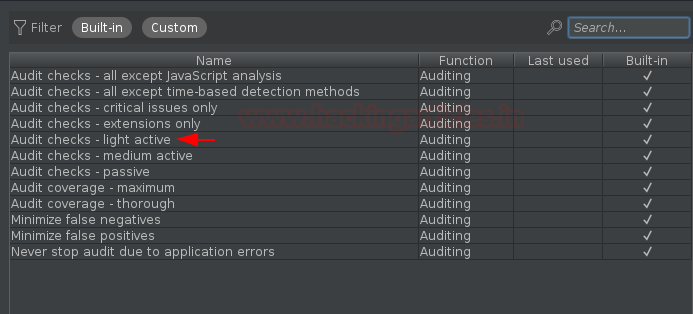
Now comes to the most important section to define the Issues reported by selecting the “Scan Type”. Here, to complete the scan faster, I’m simply taking the Light active scan option, but you can opt any of the following –
- Passive – Inspecting the application’s behaviour of requests and responses simply detects these issues.
- Light active – This method detects issues by making a small number of benign additional requests.
- Medium active – You can detect these issues by making requests that the application might reasonably view as malicious.
- Intrusive active – Making requests that carry a higher risk of damaging the application or its data detects these issues. For example, SQL injection.
- JavaScript analysis – Analyzing the JavaScript that the application executes on the client-side can detect these issues.

You might be aware of the concept of insertion points, as they represent the most important sections that attackers can exploit for vulnerabilities. They are basically locations within the requests where attackers inject payloads. However, the burp’s scanner also audits the insertion points and thus allows for manipulation in this phase.

Saving and Running the Audit
Now, as we’re done with the configuration and hit the “Save” button, the system lists our customized audit in the New Scan’s dashboard.
However, this section disables the option of Application login as there is no specific need to log in an application just for vulnerability testing.
Therefore, now we know what’s next, i.e., hitting the OK button and moving to the dashboard. And as soon as we reach there, we’ll get the result according to our configuration with about 2700 request.
But this time, the major issue is only “1”

Exploring Advanced Options
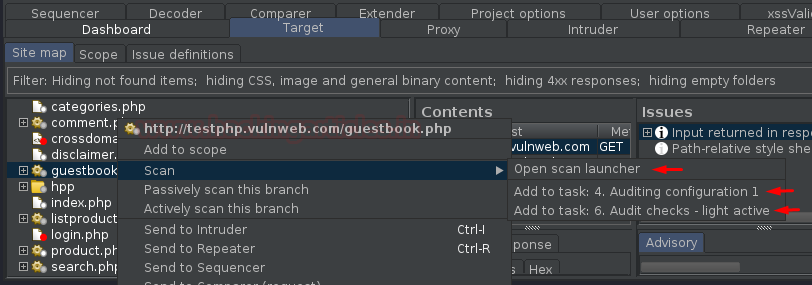
Now, if we move back to the Target tab and select any request from the left panel, we can right-click to reveal two options instead of just one. This occurs because the last customization we configured is now included in this field. Moreover, if we share any request within it, the auditing process will start accordingly.
Thereby, we’ll opt the Open scan launcher again to check the other features too. As we head back, we’re welcomed with our previous customized audit. However, at the bottom, there is a “Select from library” option. Click there and check what it offers.

So, wasn’t it a bit confusing to configure the audit by manipulating every option it has ??
Thereby, to get rid of this, burpsuite offer one more great feature to opt a built-in Audit check, where we simply need to select any and continue.
And as we select one, we’ll thus get our option listed back into the New Scan dashboard.

Hit “OK” and check the result in the dashboard. Furthermore, if we now navigate to the Target tab and right-click on any request, we will see three options instead of two.
Crawling & Scanning with an Advanced Scenario
Up till now, we’ve used the scanner and the crawler individually. However, what if we want to do both tasks together? To solve this problem, the Burp Suite creators provide an End-to-End scan option. Here, our Burp Suite will –
- Firstly, crawl the application and discover the contents and the functionalities within it.
- Further, it will start auditing it for vulnerabilities.
Thereby, to do all this, all it needs is a “URL”.
Let’s check how we can do it.
Back on the dashboard, select “New Scan”, and now this time opt for “Crawl & Audit”, further mention the URL within it.

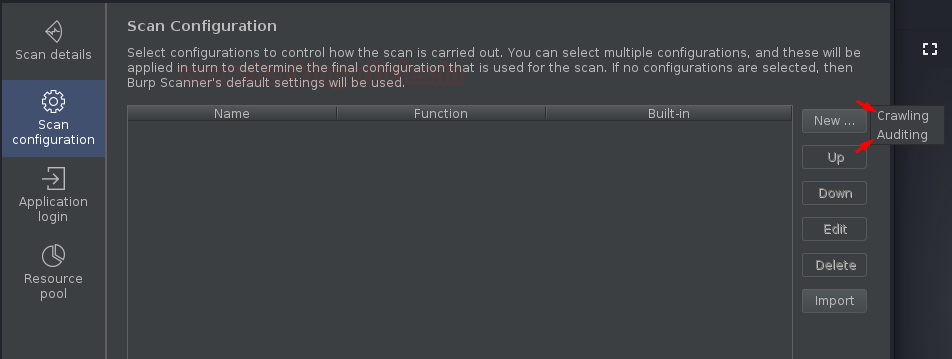
Great! Now, let’s check the Scan Configuration options. As we move there and click on the “New” button, it does not redirect us directly to the customization menu. Instead, it asks us to choose between crawl optimization or audit configuration.
However, all the internal options are the same.
Deleting the Defined Tasks
Rather not only knowing how to start or configure the things up, but we should also be aware of how to end them all. Thereby let’s click on the Dustbin icon defined up as a Task option, in order to delete our completed or incompleted tasks.

And as we do so, we got the confirmation pop-up as

To learn more about Burp Suite for Pentester. Follow this Link.
Author: Geet Madan is a Certified Ethical Hacker, Researcher and Technical Writer at Hacking Articles on Information Security. Contact here
Really enjoyed the lab but it is written for the Pro version of Burp Suite. Many of the features mentioned in the lab are only available with the pro version. To bad, I would have really liked to have shared this with my students. Regardless, still an excellent lab!