Beginners Guide to TShark (Part 2)
In the previous article, we learned about the basic functionalities of this wonderful tool called TShark. If you haven’t read it until now. Click here.
TL; DR
In this part, we will the Statistical Functionalities of TShark. We will understand different ways in which we can sort our traffic capture so that we can analyse it faster and effectively.
Table of Content
- Statistical Options
- Protocol Hierarchy Statistics
- Read Filter Analysis
- Endpoints Analysis
- Conversation Analysis
- Expert Mode Analysis
- Packet Distribution Tree
- Packet Length Tree
- Color Based Output Analysis
- Ring Buffer Analysis
- Auto-Stop
- Duration
- File Size
- Data-Link Types
Statistical Options
TShark collects different types of Statistics and displays their result after finishing the reading of the captured file. To accomplish this, we will be using the “-z” parameter with TShark. Initially, to learn about all the different options inside the “-z” parameter, we will be running the TShark with the “-z” parameter followed by the help keyword. This gives us an exhaustive list of various supported formats as shown in the image given below.

Protocol Hierarchy Statistics
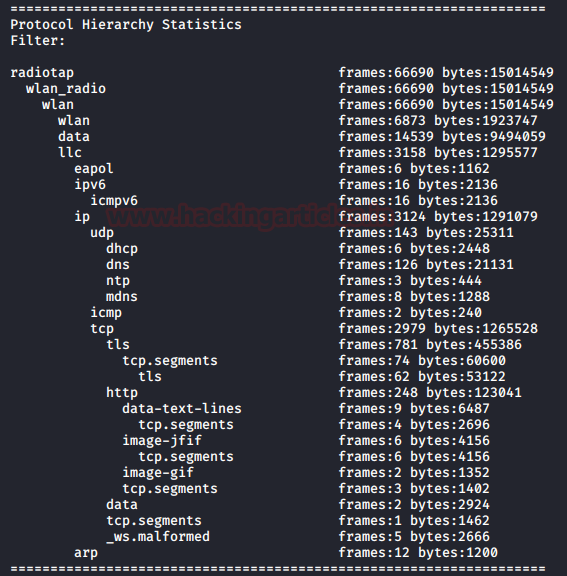
Using the TShark we can create a Protocol based Hierarchy Statistics listing the number of packets and bytes using the “io,phs” option in the “-z” parameter. In the case where no filter is given after the “io,phs” option, the statistics will be calculated for all the packets in the scope. But if a specific filter is provided than the TShark will calculate statistics for those packets that match the filter provided by the user. For our demonstration, we first captured some traffic and wrote the contents on a pcap file using the techniques that we learned in part 1 of this article series. Then we will be taking the traffic from the file, and then sort the data into a Protocol Hierarchy. Here we can observe that we have the frames count, size of packets in bytes and the Protocol used for the transmission.
tshark -r wlan.pcap -z io,phs

Read Filter Analysis
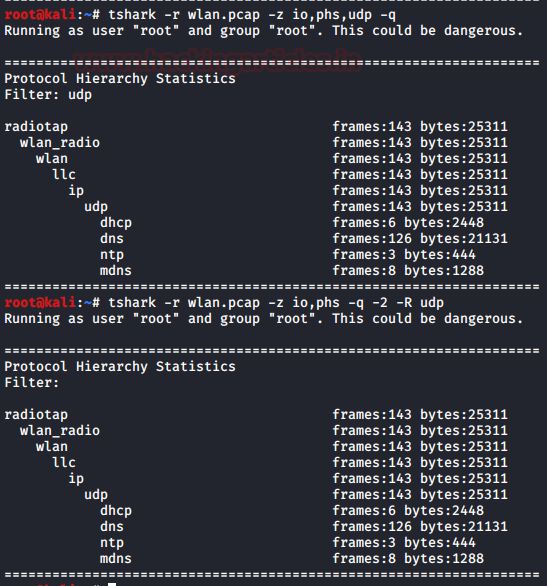
During the first pass analysis of the packet, the specified filter (which uses the syntax of read/display filters, rather than that of capture filters) has to be applied. Packets which are not matching the filter are not considered for future passes. This parameter makes sense with multiple passes. Note that forward-looking fields such as ‘response in frame #’ cannot be used with this filter since they will not have been calculated when this filter is applied. The “-2” parameter performs a two-pass analysis. This causes TShark to buffer output until the entire first pass is done, but allows it to fill in fields that require future knowledge, it also permits reassembly frame dependencies to be calculated correctly. Here we can see two different analysis one of them is first-pass analysis and the latter is the two-pass analysis.
tshark -r wlan.pcap -z io,phs,udp -q
tshark -r wlan.pcap -z io,phs -q -2 -R udp

Endpoints Analysis
Our next option which helps us with the statistics is the “endpoints”. It will create a table that will list all endpoints that could be seen in the capture. The type function which can be used with the endpoint option will specify the endpoint type for which we want to generate the statistics.
The list of Endpoints that are supported by TShark is:
| Sno. | Filter | Description |
| 1 | “bluetooth” | Bluetooth Addresses |
| 2 | “eth” | Ethernet Addresses |
| 3 | “fc” | Fiber Channel Addresses |
| 4 | “fddi” | FDDI Addresses |
| 5 | “ip” | IPv4 Addresses |
| 6 | “ipv6” | IPv6 Addresses |
| 7 | “ipx” | IPX Addresses |
| 8 | “jxta” | JXTS Addresses |
| 9 | “ncp” | NCP Addresses |
| 10 | “rsvp” | RSVP Addresses |
| 11 | “sctp” | SCTP Addresses |
| 12 | “tcp” | TCP/IP socket pairs Both IPv4 and IPv6 supported |
| 13 | “tr” | Token Ring Addresses |
| 14 | “usb” | USB Addresses |
| 15 | “udp” | UDP/IP socket pairs Both IPv4 and IPv6 supported |
| 16 | “wlan” | IEEE 802.11 addresses |
In case that we have specified the filter option then the statistics calculations are done for that particular specified filter. The table like the one generated in the image shown below is generated by picking up single line form each conversation and displayed against the number of packets per byte in each direction as well as the total number of packets per byte. This table is by default sorted according to the total number of frames.
tshark -r wlan.pcap -z endpoints,wlan -q | head

Conversation Analysis
Let’s move on to the next option which is quite similar to the previous option. It helps us with the statistics is the “conversation”. It will create a table that will list all conversation that could be seen in the capture. The type function which can be used with the conversation option will specify the conversation type for which we want to generate the statistics.
If we have specified the filter option then the statistics calculations are done for that particular specified filter. The table generated by picking up single line form each conversation and displayed against the number of packets per byte in each direction, the total number of packets per byte as well as the direction of the conversation travel. This table is by default sorted according to the total number of frames.
tshark -r wlan.pcap -z conv,wlan -q | head

Expert Mode Analysis
The TShark Statistics Module have an Expert Mode. It collects a huge amount of data based on Expert Info and then prints this information in a specific order. All this data is grouped in the sets of severity like Errors, Warnings, etc., We can use the expert mode with a particular protocol as well. In that case, it will display all the expert items of that particular protocol.
tshark -r wlan.pcap -z expert -q | head

Packet Distribution Tree
In this option, we take the traffic form a packet and then drive it through the “http,tree” option under the “-z” parameter to count the number of the HTTP requests, their mods as well as the status code. This is a rather modular approach that is very easy to understand and analyse. Here in our case, we took the packet that we captured earlier and then drove it through the tree option that gave us the Information that a total of 126 requests were generated out of which 14 gave back the “200 OK”. It means that the rest of them either gave back an error or were redirected to another server giving back a 3XX series status code.
tshark -r wlan.pcap -z http,tree -q

Packet Length Tree
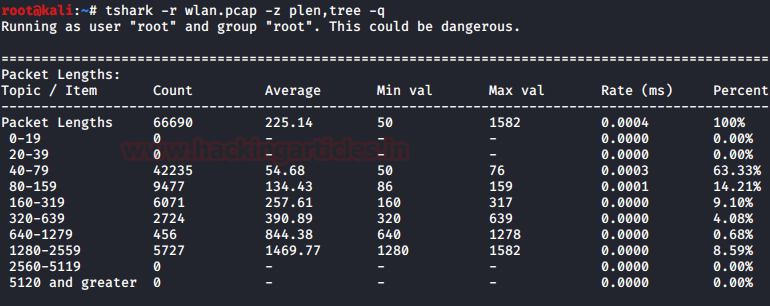
As long as we are talking about the Tree option, let’s explore it a bit. We have a large variety of ways in which we can use the tree option in combination with other option. To demonstrate that, we decided to use the packet length option with the tree option. This will sort the data on the basis of the size of the packets and then generate a table with it. Now, this table will not only consist of the length of the packets, but it will also have the count of the packet. The minimum value of the length in the range of the size of the packets. It will also calculate the size as well as the Percentage of the packets inside the range of packet length
tshark -r wlan.pcap -z plen,tree -q

Color Based Output Analysis
Note: Your terminal must support color output in order for this option to work correctly.
We can enable the coloring of packets according to standard Wireshark color filters. On Windows, colors are limited to the standard console character attribute colors. In this option, we can set up the colors according to the display filter. This helps in quickly locating a specific packet in the bunch of similar packets. It also helps in locating Handshakes in communication traffic. This can be enabled using the following command.
tshark -r color.pcap --color

Ring Buffer Analysis
By default, the TShark to runs in the “multiple files” mode. In this mode, the TShark writes into several capture files. When the first capture file fills up to a certain capacity, the TShark switches to the next file and so on. The file names that we want to create can be stated using the -w parameter. The number of files, creation data and creation time will be concatenated with the name provided next to -w parameter to form the complete name of the file.
The files option will fill up new files until the number of files is specified. at that moment the TShark will discard data in the first file and start writing to that file and so on. If the files option is not set, new files filled up until one of the captures stops conditions matches or until the disk is full.
There are a lot of criteria upon which the ring buffer works but, in our demonstration, we used 2 of them. Files and the Filesize.
files: value begin again with the first file after value number of files were written (form a ring buffer). This value must be less than 100000.
filesize: value switches to the next file after it reaches a size of value kB. Note that the file size is limited to a maximum value of 2 GiB.
tshark -I eth0 -w packetsbuffer.pcap -b filesize:1 -b file:3

Auto-Stop
Under the huge array of the options, we have one option called auto-stop. As the name tells us that it will stop the traffic capture after the criteria are matched.
Duration
We have a couple of options, in our demonstration, we used the duration criteria. We specified the duration to 10. This value is in seconds. So, the capture tells us that in the time of 10 seconds, we captured 9 packets.
tshark -i eth0 -a duration:10

File Size
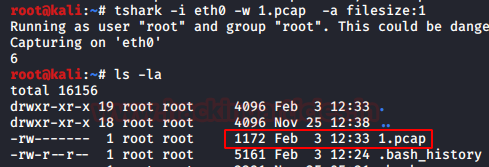
Now another criterion for the auto-stop option is the file size. The TShark will stop writing to the specified capture file after it reaches a size provided by the user. In our demonstration, we set the filesize to 1. This value is in kB. We used the directory listing command to show that the capture was terminated as soon as the file reached the size of 1 kB.
tshark -i eth0 -w 1.pcap -a filesize:1

Data-Link Types
At last, we can also modify the statistics of the captured traffic data based on the Data-Link Types. For that we will have to use an independent parameter, “-L”. In our demonstration, we used the “-L” parameter to show that we have data links like EN10MB specified for the Ethernet Traffic and others.
tshark -L

Author: Shubham Sharma is a Pentester, Cybersecurity Researcher and Enthusiast, contact here.