Beginners Guide to TShark (Part 1)
In this article, we will learn about TShark which is a well-known network protocol analyzer. It lets us capture the data packets, from the live network. It also allows us, to read or analyze the previously captured data packets of a saved file.
Table of content
- Network traffic
- Introduction to TShark
- List interfaces
- Capture traffic
- Capture the interface in promiscuous mode
- Capture the packet count
- Read and Write in a file
- Verbose mode
- Output Formats
- Difference between decoded packets and encoded packets
- Converting PDML file HTML page
- Capturing packets of a particular port
- Display filter
Network traffic
As we know, network traffic or data traffic is the amount of data transferring across the network at some given point of time. Network data, in computer networks, is in the form of network data packets. Analyzing these network packets provides network security as it helps us to monitor traffic. As a benefit, if there is some unusual amount of data traffic in a network which is a possible sign of an attack then Tshark can help us know before it too late and the attack can be terminated as data traffic reports provide insights into preventing some good attacks.
Traffic volume is a term which comes under network traffic analyzing. Network traffic volume is the measure of the total work done. It is defined as the average data traffic intensity and time period of its network data packet study.
Introduction to TShark
Tshark, a well known and powerful command-line tool and is used as a network analyzer. It is developed by Wireshark. It’s working structure is quite similar to Tcpdump, but it has some powerful decoders and filters. It is capable of capturing the data packets information of different network layers and display them in different formats.
TShark is used to analyze real-time network traffic and it can read .pcap files to analyze the information, dig into the details of those connections, helping security professionals to identify their network problem.
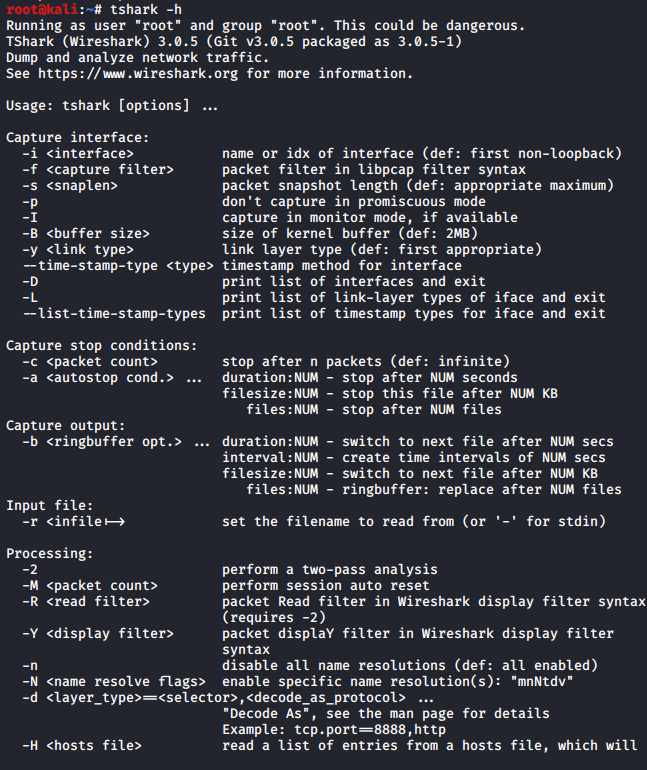
TShark is a command-line based tool, which can do anything that Wireshark does. So let us start our learning process with TShark and therefore launch this tool and explore its options. To check out all the parameters, use the following command :
tshark -h
List interfaces
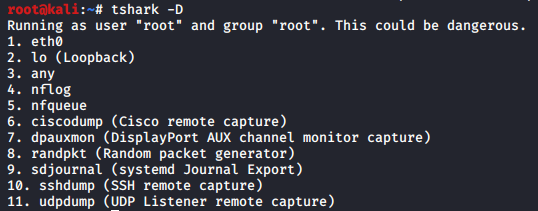
TShark prints a list of the interfaces whose traffic it can capture. Each interface is referred to by their serial number and as you can see it is followed by a text description of the network interface. These interfaces can be specified using -i parameter; which is used to specify the network whose traffic we want to capture. And to check out these interfaces you can use the parameter -D as shown in the image below :
tshark -D
Capture traffic
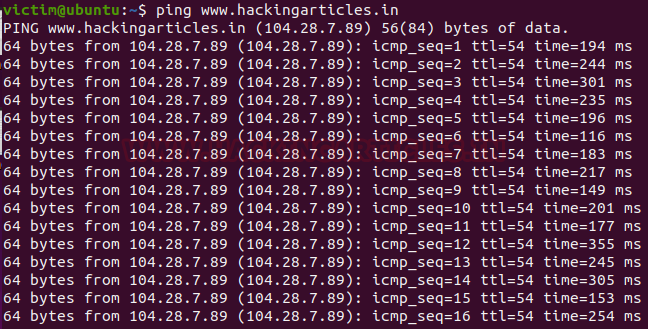
Let’s now try to capture traffic, we have various choice of interface to capture traffic and therefore one can choose whichever depending on their needs and requirement. But in our scenario, the interface which we are going to use is “eth0”. In order to capture traffic, we need to initiate one too as we are testing on a controlled network and for that use ping command and then to capture traffic we have to just specify the interface name by using -i parameter as shown in the image below :
ping hackingarticles.in/
tshark -i eth0
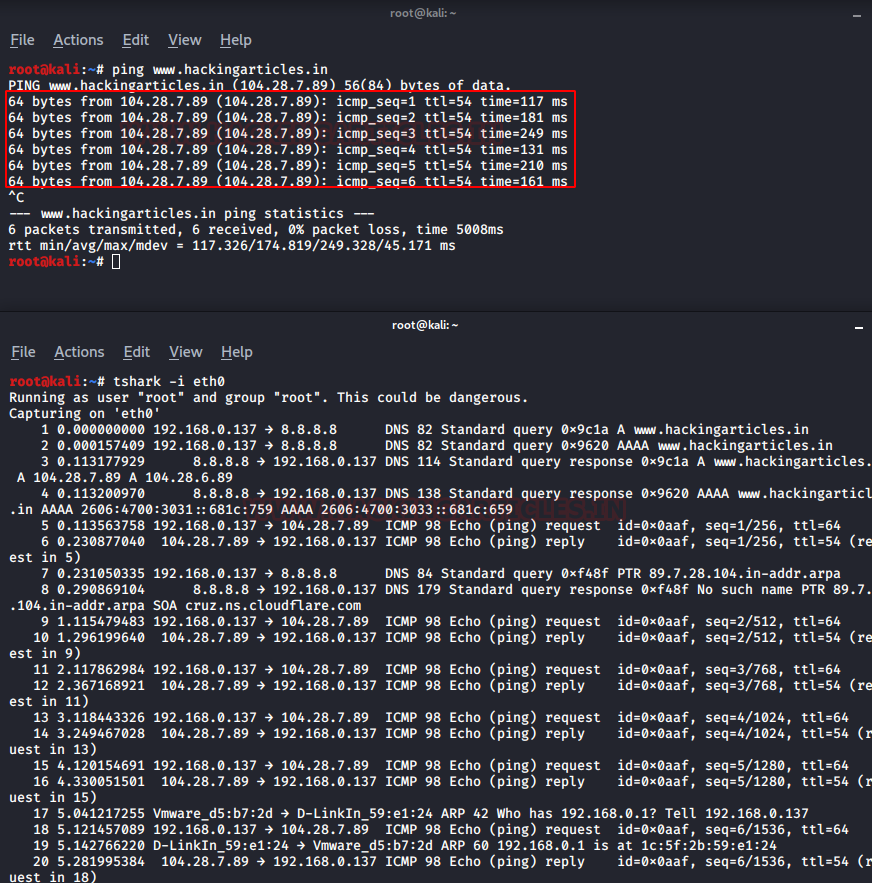
As we can clearly see it is performing its three-way handshake, then starts the process of ICMP request and reply.
Promiscuous mode
In the networking, an interface controller uses promiscuous mode to cause tshark to pass all the traffic it receives to the CPU rather than passing the frames to the promiscuous mode, which normally facilitates packet sniffing on a router or on a computer connected to a wired network or a part of LAN.
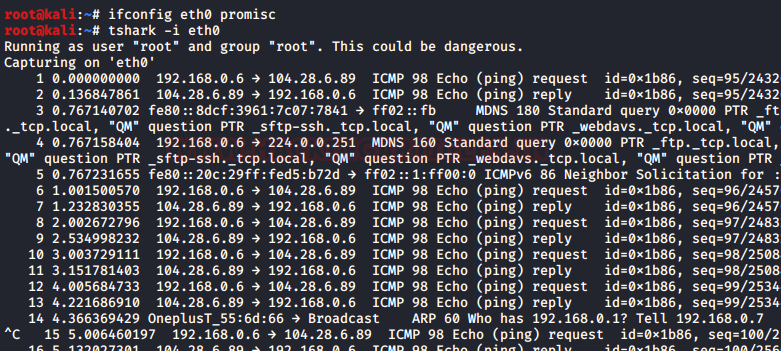
When using this mode, we will need to configure it with the help of ifconfig so that it let us capture the data packets of the whole network. Therefore, we will start by pinging a website and try to capture its data packets.
Now, configure the promiscuous mode by following these commands and try to capture the packets :
ifconfig eth0 promisc
tshark -i eth0
Packet count
Tshark has amazing features with which we can work more efficiently and we can access these features using various parameters. One such parameter is ‘-c’, it lets us capture the exact amount of data that we require and it will display only those. This option helps us to refine the outcome of captured traffic.
tshark -i eth0 -c 10
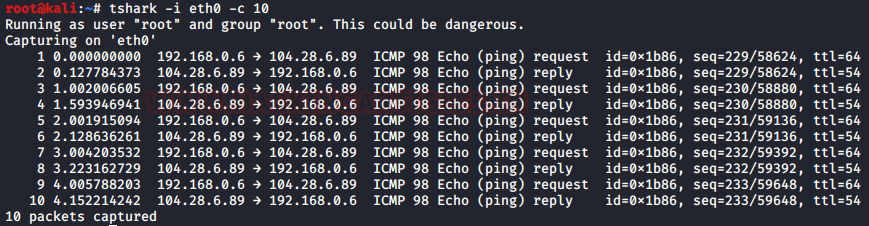
As we can clearly see in the image above that it stops after the 10 counts.
Read and Write in a file
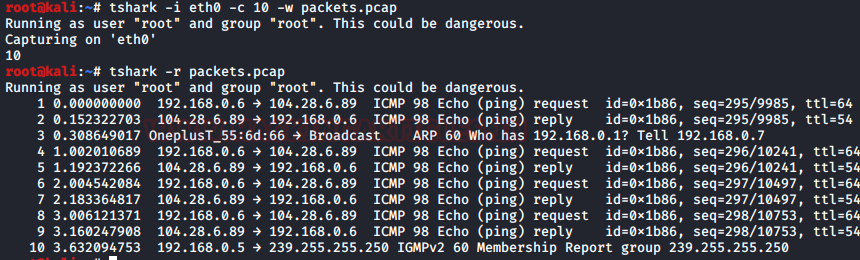
In Tshark we can write and read into .pcap file. Write option (-w) allows us to write raw packet data output to a standard .pcap file whereas read option (-r) help us to read that raw output data packets in our desired manner. To write the packets into a .pcap file use the following command :
tshark -i eth0 -c 10 -w packets.pcap
And to read the said .pcap file use the following command :
tshark -r packets.pcap
Verbose mode
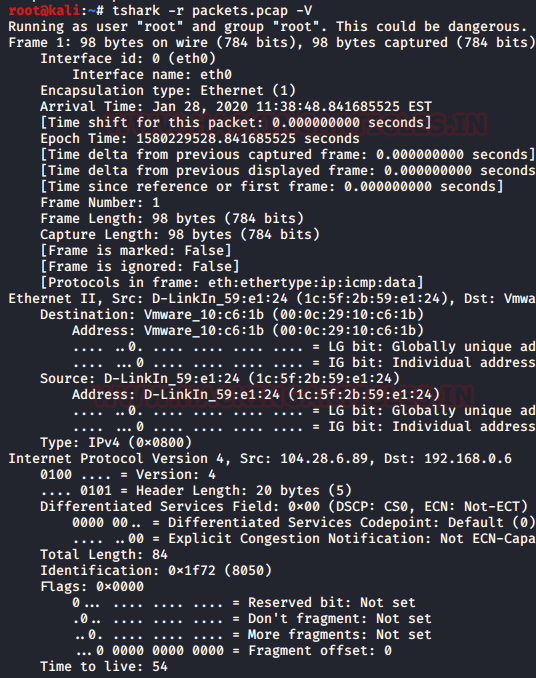
The verbose mode provides us with additional details of a packet in traffic. Using the verbose mode, we can see the information that each packet contains and for this option we can use the parameter -V.
tshark -r packets.pcap -V
Output formats
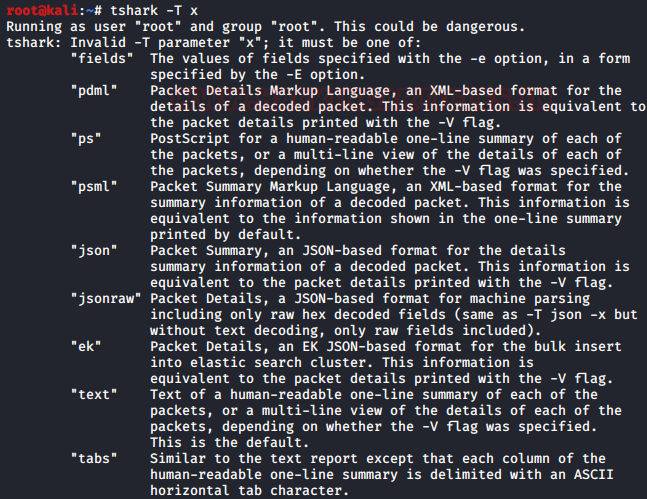
For our convenience, in tshark, we have -T option that lets us save decoded packets in various output formats. It can set the format of the output in the way that it becomes easy to understand. To see all the available options type the following command :
tshark -T x
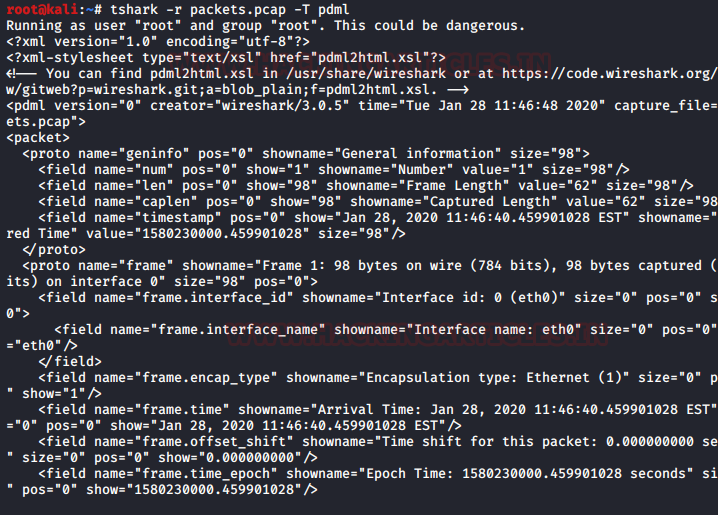
PDML
PDML stands for Packet Details Mark-Up Language which is an XML based. This information is quite equivalent to the verbose mode which we used earlier. And to have output in this format type the following command :
tshark -r packets.pcap -T pdml
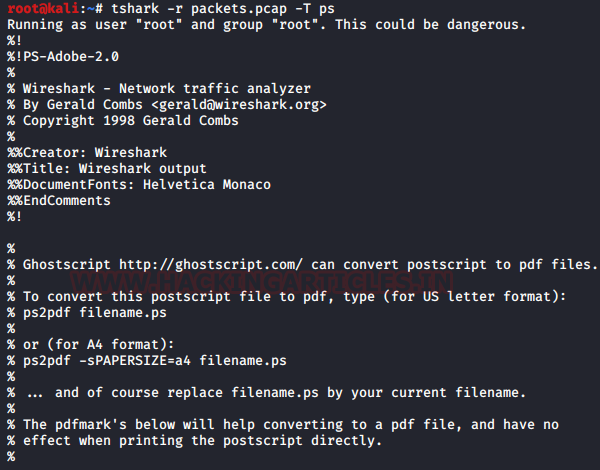
PS
PS stands for PostScript. This output is in a form of oneliner summary of each data packets or multi-line detail view of each data packets depending upon each data packet specification. These one-liners are very quick to understand as well as reliable. For this, use the following command :
tshark -r packets.pcap -T ps
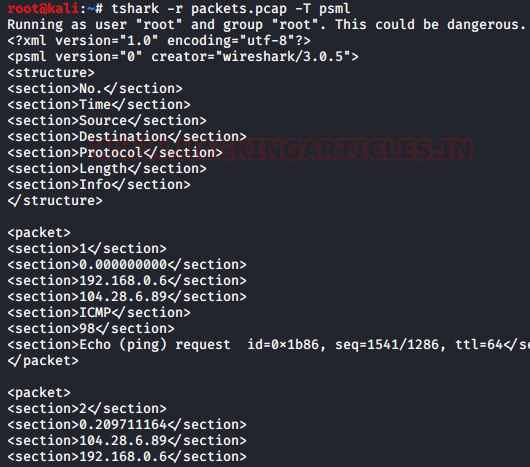
PSML
PSML stands for Packet Summary Mark-Up Language. It is also an XML based format like PDML which summarises the detailed information of the packets. And for this format type :
tshark -r packets.pcap -T psml
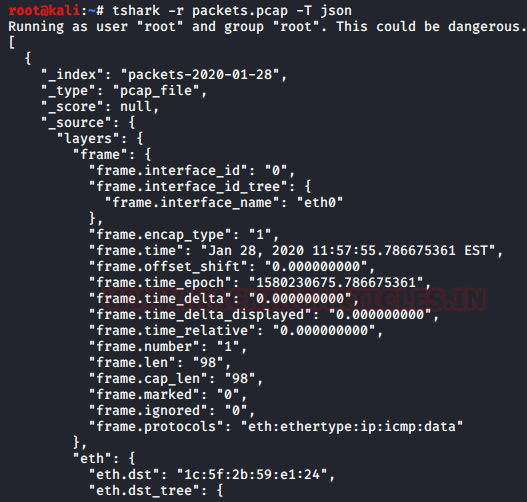
JSON
JSON stands for Java-Script Object Notation. It is an open standard file format that displays text in a readable form. The information in this format is fully documented and referred at wolfram. To see that packets in this format, type :
tshark -r packets.pcap -T json
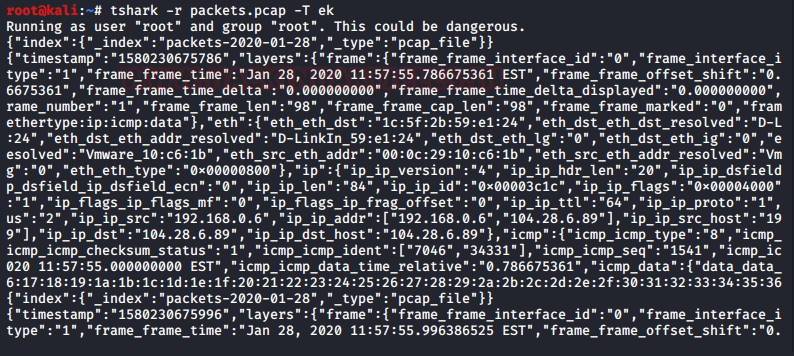
EK
It is newline delimited JSON format function for bulk import into the elastic search option. And for this format use the following command :
tshark -r packets.pcap -T ek
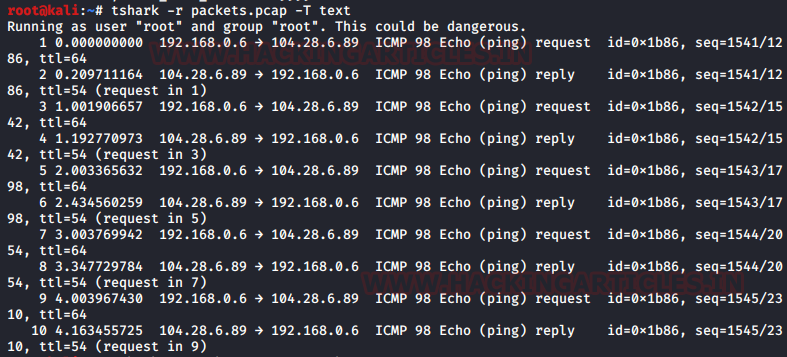
Text
Text is a human-readable one lines summary of each of the packets. This is the simplest of the formats. And for this, use the following command :
tshark -r packets.pcap -T text
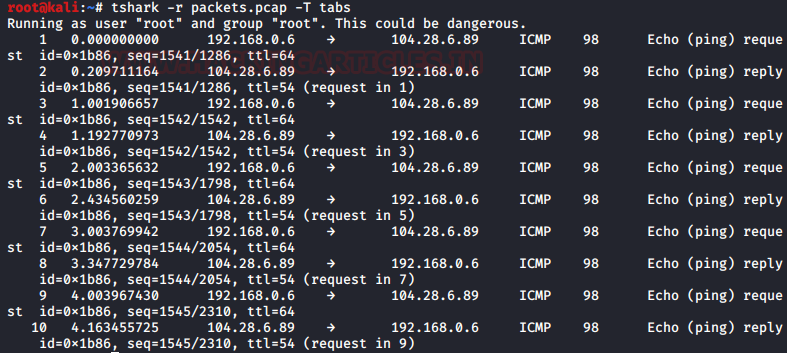
Tabs
This option is quite similar to the text except, it includes an ASCII horizontal tab (oxo9) character as the delimiter between each column. To try this, type :
tshark -r packets.pcap -T tabs
Difference between decoded packets and encoded packets
When we try to write the live data packets in a .pcap format file; we compress all that data packets in smaller segments. To better understand these data packets we need to decode them which leads to a difference in the size of the file and to check the size of any given file at the given moment use the following command :
ls -lh packets.p*
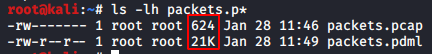
Like we discussed there is a huge difference in these files, that’s why we use decoding techniques to extract this information.
Converting PDML file HTML page
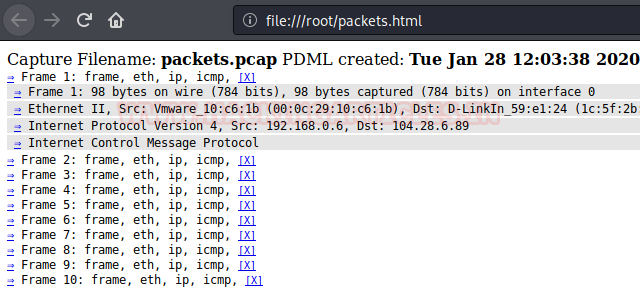
The only difference between the Wireshark and tshark is that Wireshark is a GUI based tool and tshark is a command-line based tool. But with the help of some external source, we can also view our data packets in HTML. So to achieve that first, we need to save our data packets in PDML format and then convert it into an XML file using the following command :
tshark -r packets.pcap -T pdml > packets.xml
The XML file will be saved at location /usr/share/wireshark/pdml2html.xsl. So, we are going to use xsltproc tool to execute this file it which will help us to create our HTML page. Creating the HTML page will format all the unnecessary information and only let us view the usable data. To create the HTML use following command
xsltproc /usr/share/wireshark/pdml2html.xsl packets.xml > packets.html
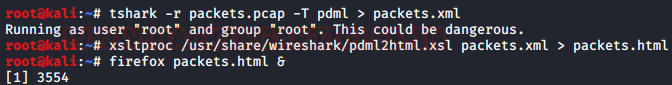
To open the HTML page in the browser, refer to the above image and use the following command :
firefox packets.html &
Capturing packets of a particular port
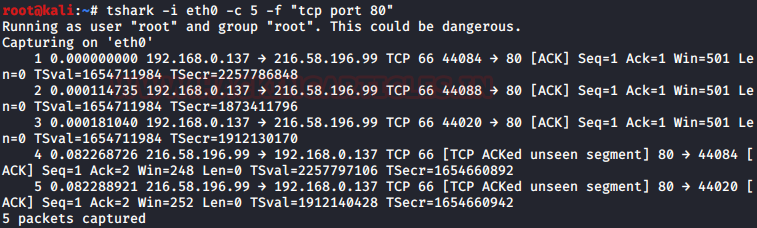
A lot of times we use Wireshark on a dedicated port. And by using the -f option we can capture data packets of a particular port. It helps us to better analyze the data packets of the network. We are using this feature to capture TCP port 80 and the command for this is :
tshark -i eth0 -c 5 -f "tcp port 80"
Display filter
Display filter was introduced by Wireshark. It helps us to filter the captured data packets or live data packets. With the help of this filter, we can request for any kind of filter that we want to capture in the live environment.
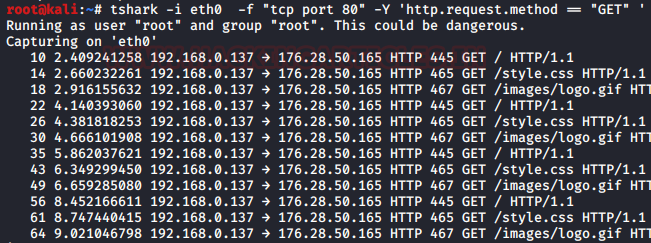
In our scenario, we apply the GET request filter to capture only GET request from the traffic and for, use the following command :
tshark -i eth0 -c 5 -f "tcp port 80" -Y 'http.request.method == "GET" '
Conclusion
This article focuses on the basic commands and functionality of tshark as it is the first article in the series. So get yourself familiar with the features of it as and stay tuned for the advance features of tshark in our next article.
To learn more about Penteration Testing. Follow this Link.
Author: Shubham Sharma is a Pentester, Cybersecurity Researcher and Enthusiast, contact here.
Hello, very good!!!
Really do enjoy your work guys,
Wish one day I’ll be as good as you..
Great article
I’m a big fan of your blog