Comprehensive Guide to tcpdump (Part 3)
This is the third article in the Comprehensive Guide to tcpdump Series. Please find the first and second articles of the series below.
In this part, we will cover some of the advance features which we were unable to cover in the previous parts of the series. So we can get more benefits from this tool.
Table of Content
- Version Information
- Quick mode
- Verbose mode
- HTTP Requests
- User Agent
- Port Range
- Destination
- Source
- Network
- TCP Packets
- Tcpdump to Wireshark
Version Information
Let’s begin with one of the simplest commands so that we can understand and relate all the practicals during the article. We can use this parameter to print the tcpdump, libpcap and OpenSSL version string.
tcpdump --version

Quick Mode
Arguably if the network is very quite, performing any operation during that time will take more time than usual. The person who developed tcpdump thought of this conundrum and gave us the way to speed up the process by using the “-q” parameter. It will print less information about protocols and data packets to save time.
tcpdump -i eth0 -c 5
tcpdump -i eth0 -c 5 -q

Verbose Mode
The verbose mode is famous to provide extra information regarding operations. in TCPDump, verbose mode provides such the information too. For instance, time to live, identification, total length. It can also enable additional packet integrity checks such as verifying the IP and ICMP header checksum values.
TCPDump provides us with plenty of parameters that are moved around this mode like -v, -vv, -vvv, where each parameter has its unique efficiency.
- -v parameter is the traditional verbose mode.
- -vv parameter is more than the traditional verbose mode, additional fields are printed from NFS (Network File System) reply packets and SMB packets are fully decoded.
- -vvv parameter has something more to provide like tenet options etc.
tcpdump -i eth0 -c 2
tcpdump -i eth0 -c 2 -v
tcpdump -i eth0 -c 2 -vv
tcpdump -i eth0 -c 2 -vvv

HTTP Requests
As we all know, HTTP Requests is an information message from the client to a server over the hypertext transfer protocol (HTTP). It has various methods to deliver this information. These methods are case-sensitive and always mentioned in the UPPERCASE. Through tcpdump, we can capture these request to analyze the traffic sent over the said protocol traffic.
The method which we can capture through tcpdump are the following :
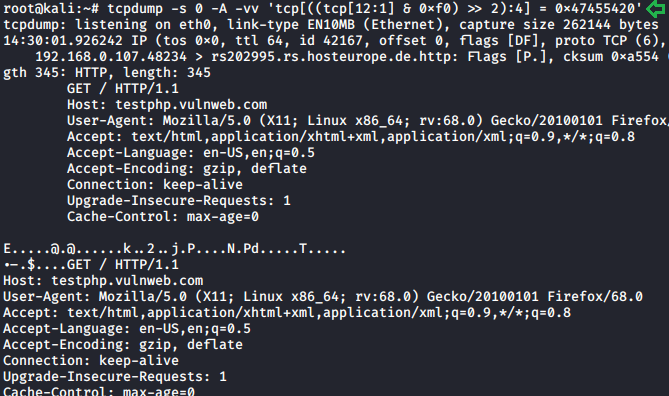
- GET- This method is used to retrieve the information from the given server using a given URL. Requests using GET should only retrieve data and have no other effect on it. We can also capture this request with the help of tcpdump.
tcpdump -s 0 -A -vv 'tcp[((tcp[12:1] & 0xf0) >> 2):4] = 0x47455420'
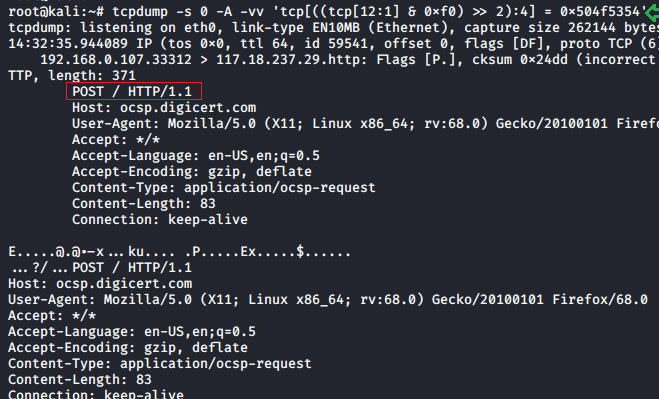
- POST- This request is used to send data to the server. Like customer information, file upload, etc. using HTML forms. Traffic over this protocol can analyzed using the following command :
tcpdump -s 0 -A -vv 'tcp[((tcp[12:1] & 0xf0) >> 2):4] = 0x504f5354'
- Request-URL- It is a uniform resource identifier, which identifies the resource on which we need to apply requests. The most common form of this is used to identify a resource on a server. If a client wants to retrieve the data directly from the server, where it originated, then it would create a connection to port 80 of the host and send the request. These requests can be captured using the following commands:
tcpdump -v -n -l | egrep -i "POST /|GET /|Host:"

User Agent
With TCPDump, you can also see which traffic is generated from which application. We can also find the user agents in our data traffic by using the following command :
tcpdump -nn -A -s150 -l | grep "User-Agent:"

Port Range
Some ordinary port filters help us to analyze the traffic on a particular port. But in tcpdump, we give our scan a range of ports through which it can monitor the destination of TCP/UDP or other port-based network protocols.
tcpdump -i eth0 portrange 21-80

Destination
To check the flow of data in network traffic towards a particular destination, use the following command for this :
tcpdump -i eth0 dst google.com

Source
To check the data traffic coming from a particular source, we can follow the command given below :
tcpdump -i eth0 src google.com

Network
To find the packets going to or from in a particular network, we can use the following function to analyze this traffic:
tcpdump net 192.168.0.1 -c5

TCP Packets
TCP packet is the format consists of the fields such as source port and destination port field. Through these fields, we can identify the endpoints of the connections and can also capture these TCP packets in its various flag format. i.e. SYN, RST and ACK.
- SYN- SYN flag is known as Synchronizes sequence numbers to initiate a TCP connection. We can capture this particular packet from traffic with the help of tcpdump.
tcpdump 'tcp[tcpflags] == tcp-syn'

- RST- RST flag is known as reset flag. This flag is sent from the receiver to the sender if a packet is sent to a particular host that was expecting it. RST flag is used to re-establish a TCP end-to-end connection. We can capture this flag from our data traffic with the help of tcpdump.
tcpdump 'tcp[tcpflags] == tcp-rst'

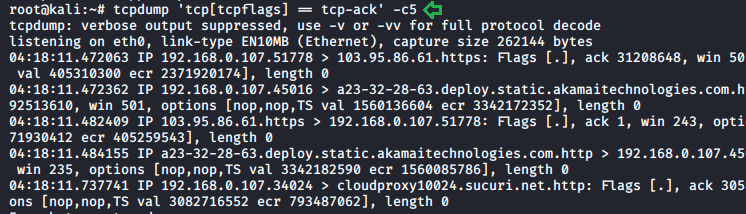
- ACK- ACK flag is known as the Acknowledgement flag. This flag is used to acknowledge that our data packet has been successfully received. We can capture these flags with tcpdump to study our data traffic.
tcpdump 'tcp[tcpflags] == tcp-ack' -c5
Tcpdump to Wireshark
The only difference between the Wireshark and TCPDump is that Wireshark is GUI while tcpdump is a command-line tool. But with the help of a few sources, we use a command on tcpdump and view our data traffic results in Wireshark which, we find is the best way to analyze our traffic. This can be done using the following command :
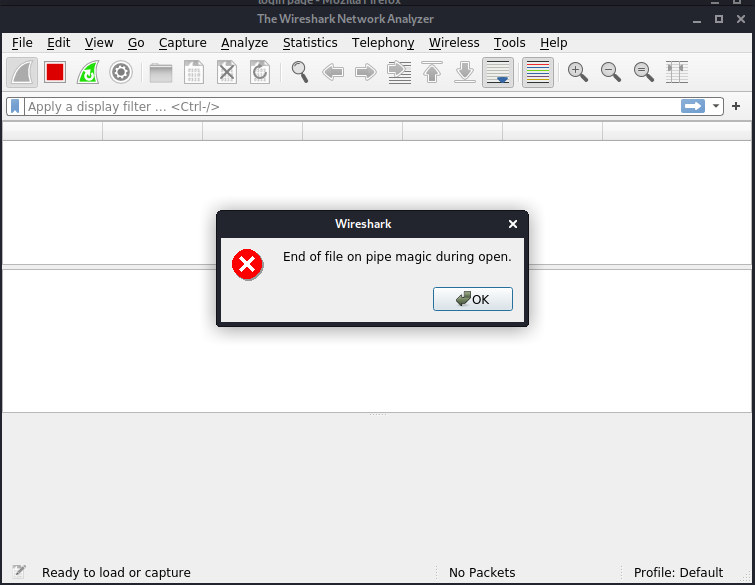
ssh root@remotesystem 'tcpdump -c20 -nn -w - not port 22' | wireshark -k -i –

After running this command it will immediately open the Wireshark and will ask a few questions about our scan. Press OK to move further.
After this, it will ask you which network interface we want to capture the data packets. In our case it will be eth0, so we are selecting that network interface.

After completing all the formalities our live data capture screen will appear with our captured data packets.

By following these steps we can run a command for tcpdump and capture its results in Wireshark.
Author: Shubham Sharma is a Pentester, Cybersecurity Researcher, Contact Linkedin and twitter.